Gabriela Belsley1, Damian J. Tyler1, Matthew D. Robson1,2, and Elizabeth M. Tunnicliffe1
1Oxford Centre for Clinical Magnetic Resonance Research, Radcliffe Department of Medicine, University of Oxford, Oxford, United Kingdom, 2Perspectum, Oxford, United Kingdom
1Oxford Centre for Clinical Magnetic Resonance Research, Radcliffe Department of Medicine, University of Oxford, Oxford, United Kingdom, 2Perspectum, Oxford, United Kingdom
A double angle method GRE-EPI B1+ mapping sequence results in a more homogenous liver T1 map at 3T than a preconditioning RF pulse B1+ mapping sequence.

Figure 1: T1 map using the (a) preRF B1+ map and the (b) DAM based GRE-EPI B1+ map to correct the nominal FAs in the SPGR sequence. The liver T1 is overall more homogenous and lower using the DAM GRE-EPI B1+ map. (c) MOLLI T1 map for matching slice location. T1 colormap scale [700 1200] ms.
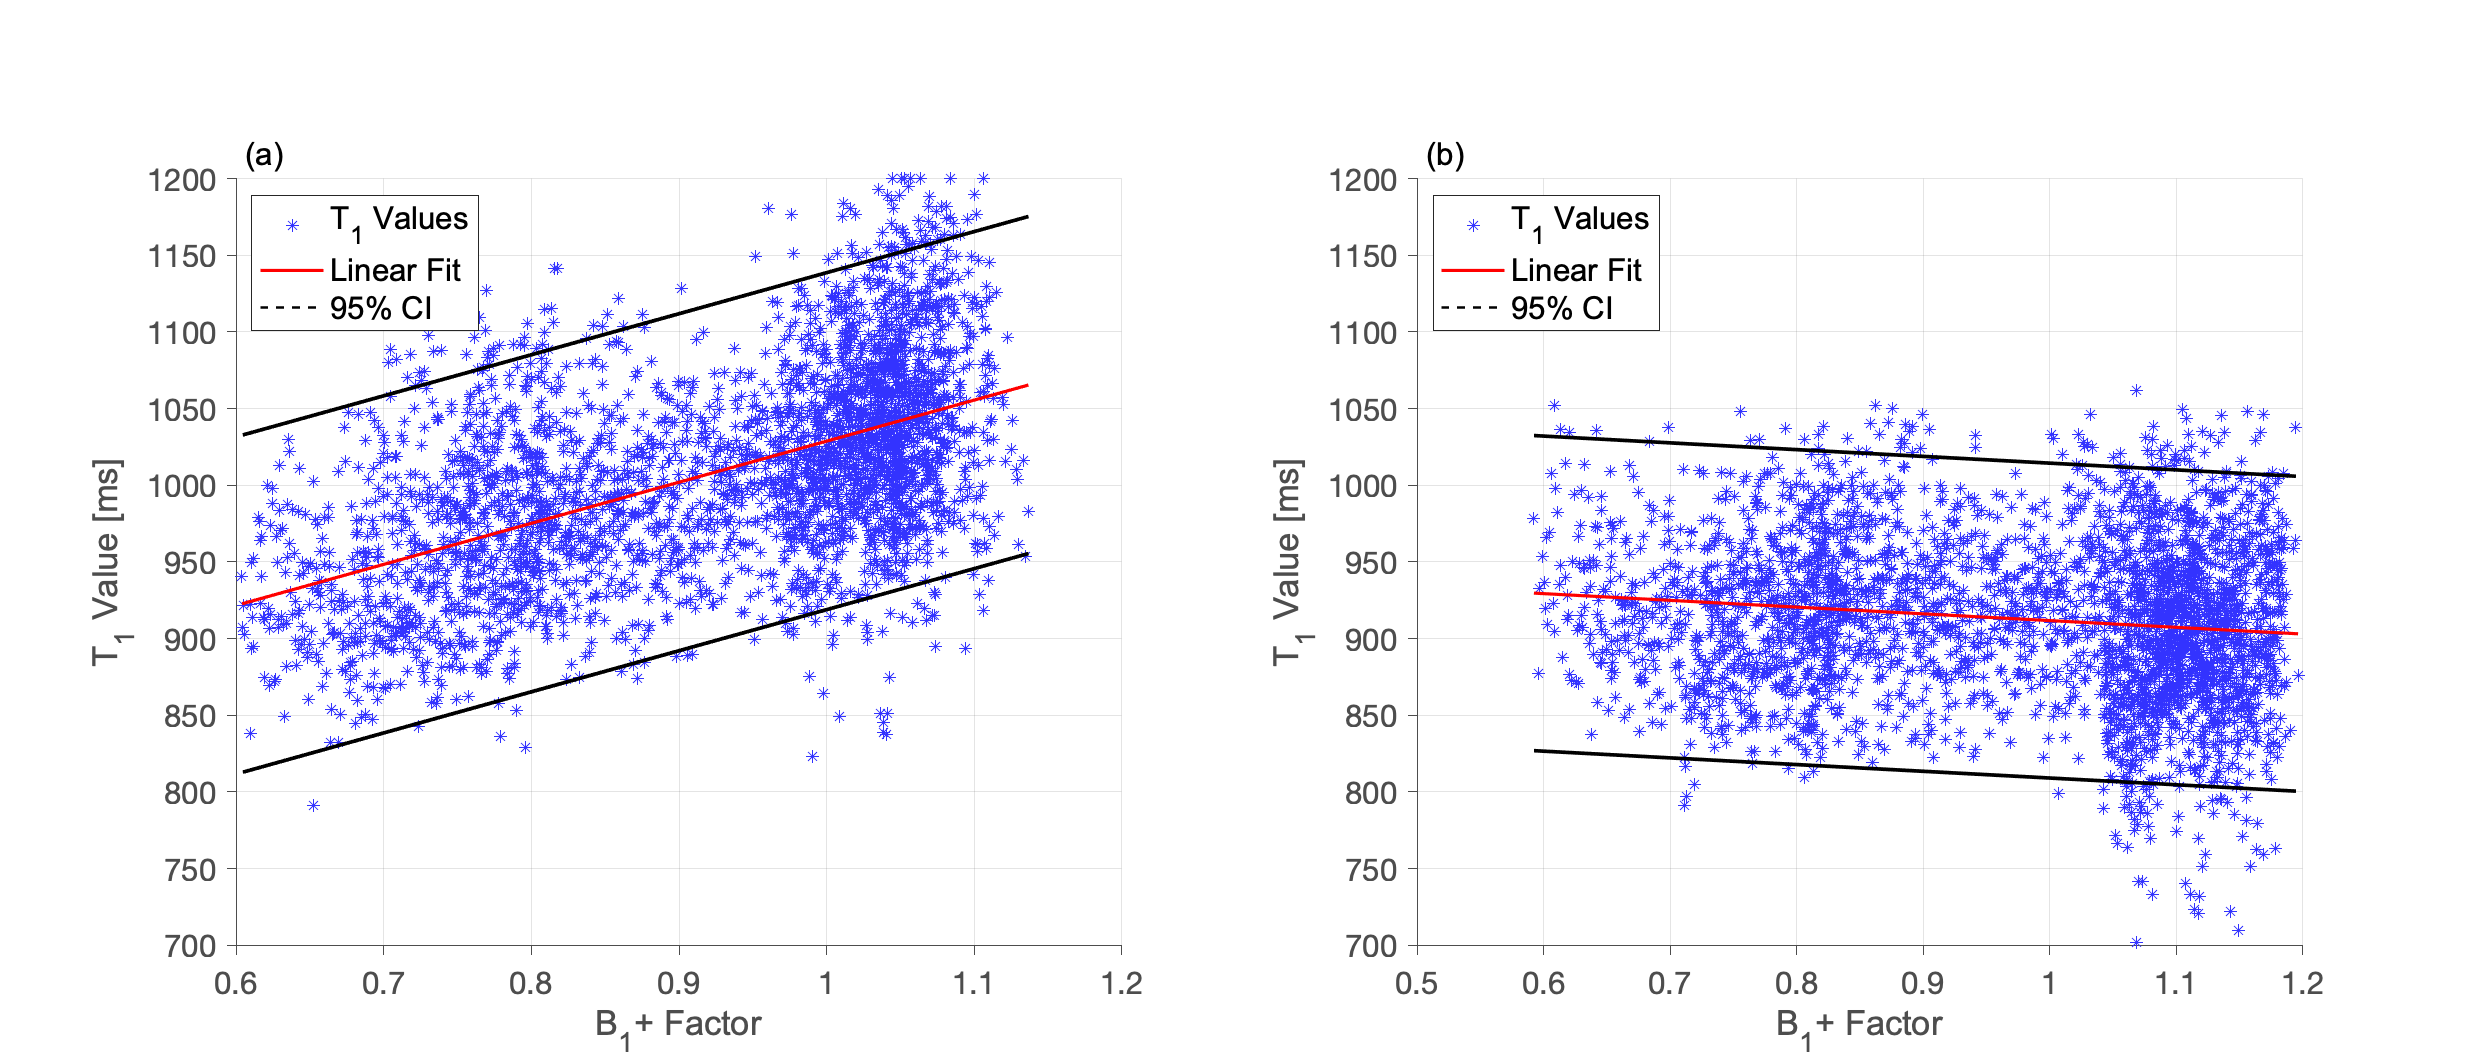
Figure 3: Correlation between masked T1 and B1+ values. (a) preRF B1+ shows a significant correlation, with a positive slope of 26.8 ms/10% change in B1+ responsible for the difference in T1 of 143 ms between the upper and lower part of the liver. The DAM GRE-EPI (b) removes most of the B1+-related variation from the T1 map showing a negligible residual correlation between T1 and B1+.