Qi Peng1, Can Wu2,3, Jee Hun Kim4,5, and Xiaojuan Li4,5,6
1Department of Radiology, Albert Einstein College of Medicine, Bronx, NY, United States, 2Department of Medical Physics, Memorial Sloan Kettering Cancer Center, New York, NY, United States, 3Philips Healthcare, Andover, MA, United States, 4Program of Advanced Musculoskeletal Imaging (PAMI), Cleveland Clinic, Cleveland, OH, United States, 5Department of Biomedical Engineering, Cleveland Clinic, Cleveland, OH, United States, 6Department of Diagnostic Radiology, Cleveland Clinic, Cleveland, OH, United States
1Department of Radiology, Albert Einstein College of Medicine, Bronx, NY, United States, 2Department of Medical Physics, Memorial Sloan Kettering Cancer Center, New York, NY, United States, 3Philips Healthcare, Andover, MA, United States, 4Program of Advanced Musculoskeletal Imaging (PAMI), Cleveland Clinic, Cleveland, OH, United States, 5Department of Biomedical Engineering, Cleveland Clinic, Cleveland, OH, United States, 6Department of Diagnostic Radiology, Cleveland Clinic, Cleveland, OH, United States
Unpaired
phase cycling was shown to potentially suffer less from B0 inhomogeneities in a
quantitative T1rho mapping sequence on phantom and human studies with halved
scan time compared to the paired traditional approach.
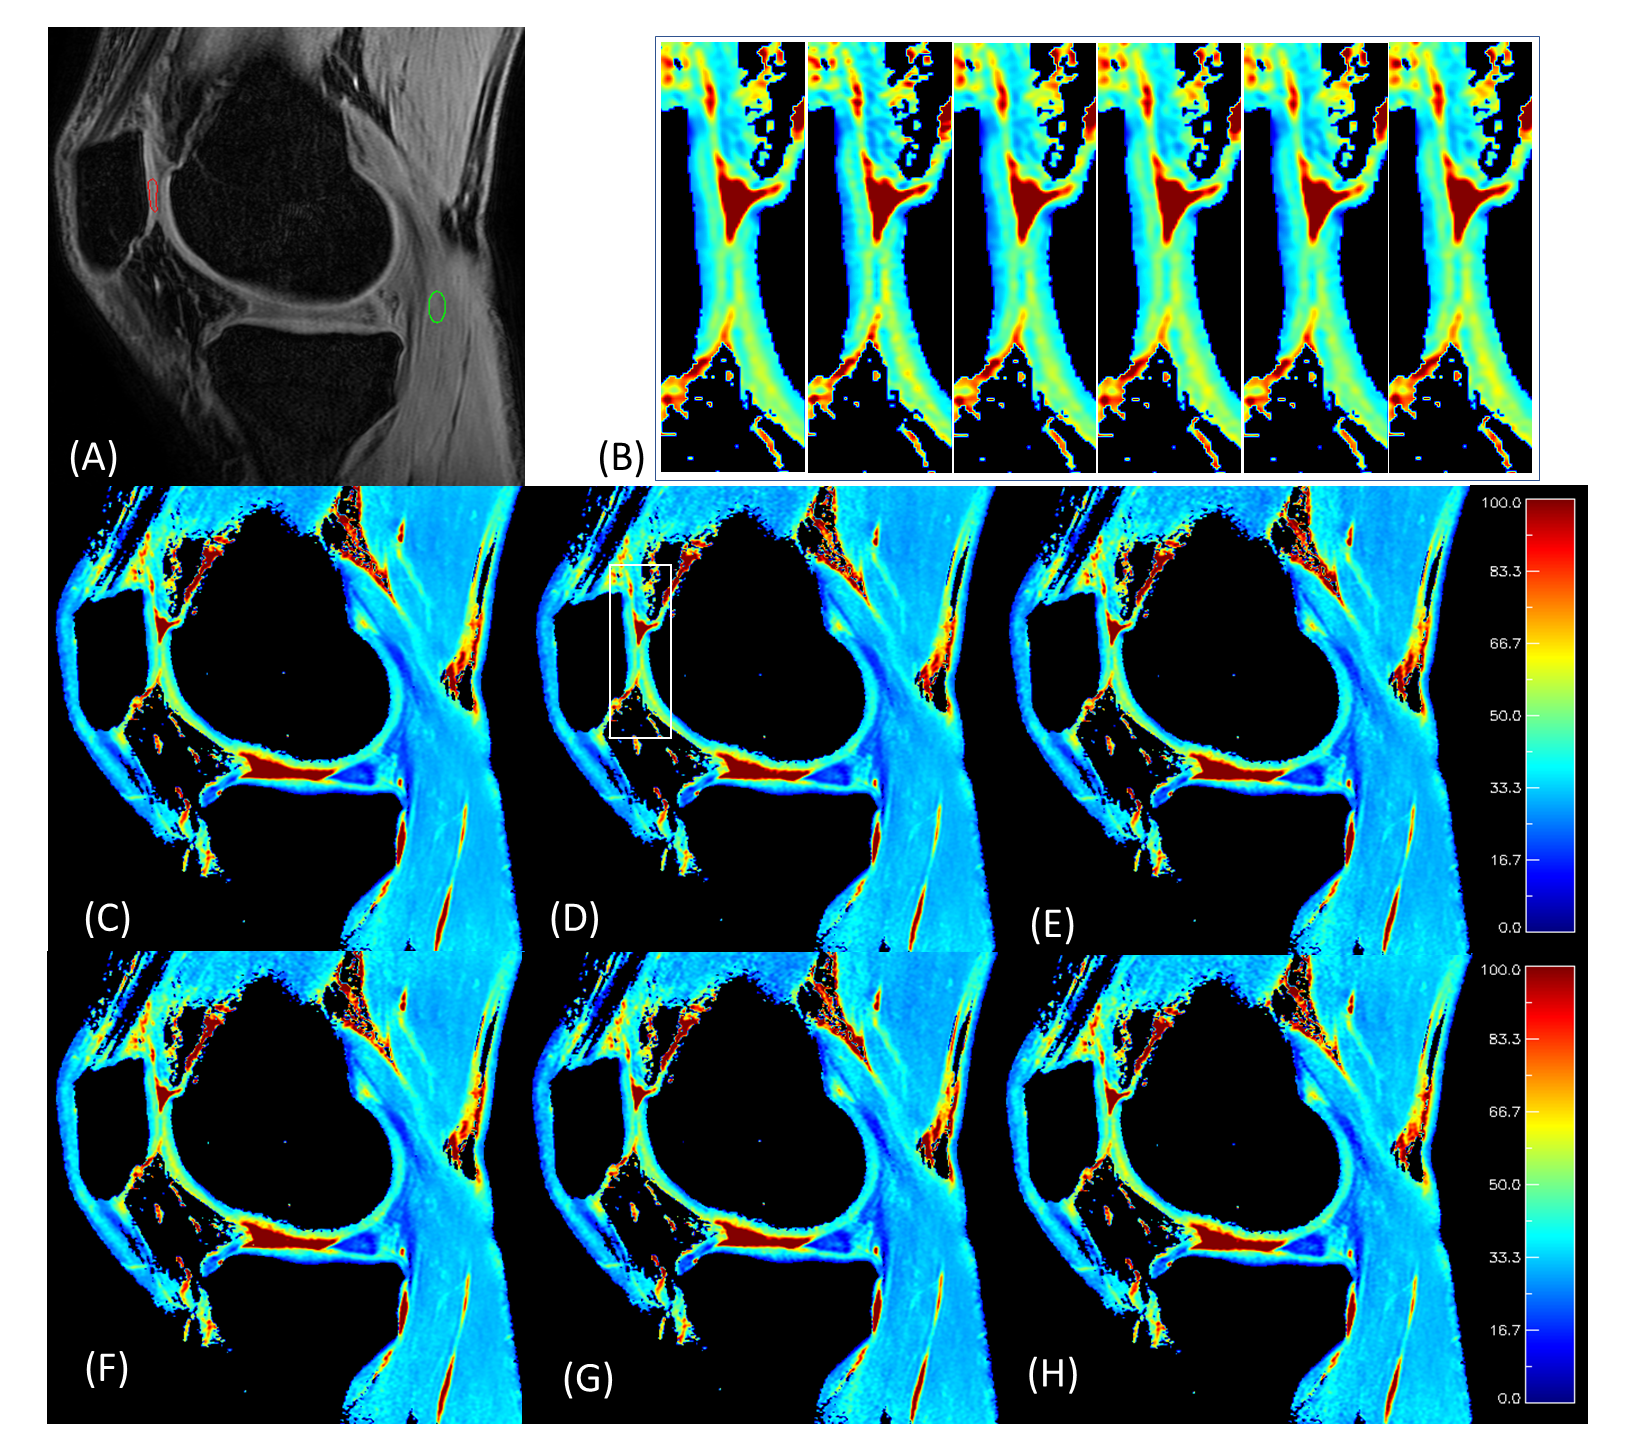
Figure 3.
Representative human T1ρ mapping results of different TSL sets. (A) TSL=0+.
Patellar (PAT) cartilage ROI is shown in red, and muscle (MUS) ROI is shown in
green; (C~H) Representative T1ρ maps obtained with TSL_sets 1~6, respectively. There is little difference between these maps.
To demonstrate the spatial fidelity of these methods, the zoom-in figures of a
small area (rectangle in (D)) are shown (B), each corresponding to TLS_set1 to
6 from left to right.

Figure 1. Representative phantom T1ρ mapping results. (A) Magnitude image of the center slice
of the phantom, with labeled tubes #1-6 and ROIs; (B-C) B0 and B1
maps of the slice at -3.6 cm with non-uniform B0 and B1
distributions; (D-I) T1ρ maps of the same slice using different TSL PC schemes of TSL_sets 1~6,
respectively. Their corresponding x- and y- line profiles from tube# 4 (as
shown in (D)) of the T1ρ map are shown in the bottom row. The y-profile is shifted by 2-pixels
for better visualization.
