Xiaoqing Liang1, Weiyin Vivian Liu2, Jingyi Wang1, and Xiaoming Li1
1Tongji Hospital, Tongji Medical College, Huazhong University of Science and Technology, Wuhan, China, 2MR Research,GE Healthcare, Beijing, China
1Tongji Hospital, Tongji Medical College, Huazhong University of Science and Technology, Wuhan, China, 2MR Research,GE Healthcare, Beijing, China
Gaussian-fitted
histogram analysis of T2 relaxation time could achieve quantitative measurement
of the distinction between the
nucleus pulposusand anulus fibrosus, and Gaussian-fitted histogram
parameters have good performance in diagnosing and staging disc degeneration.
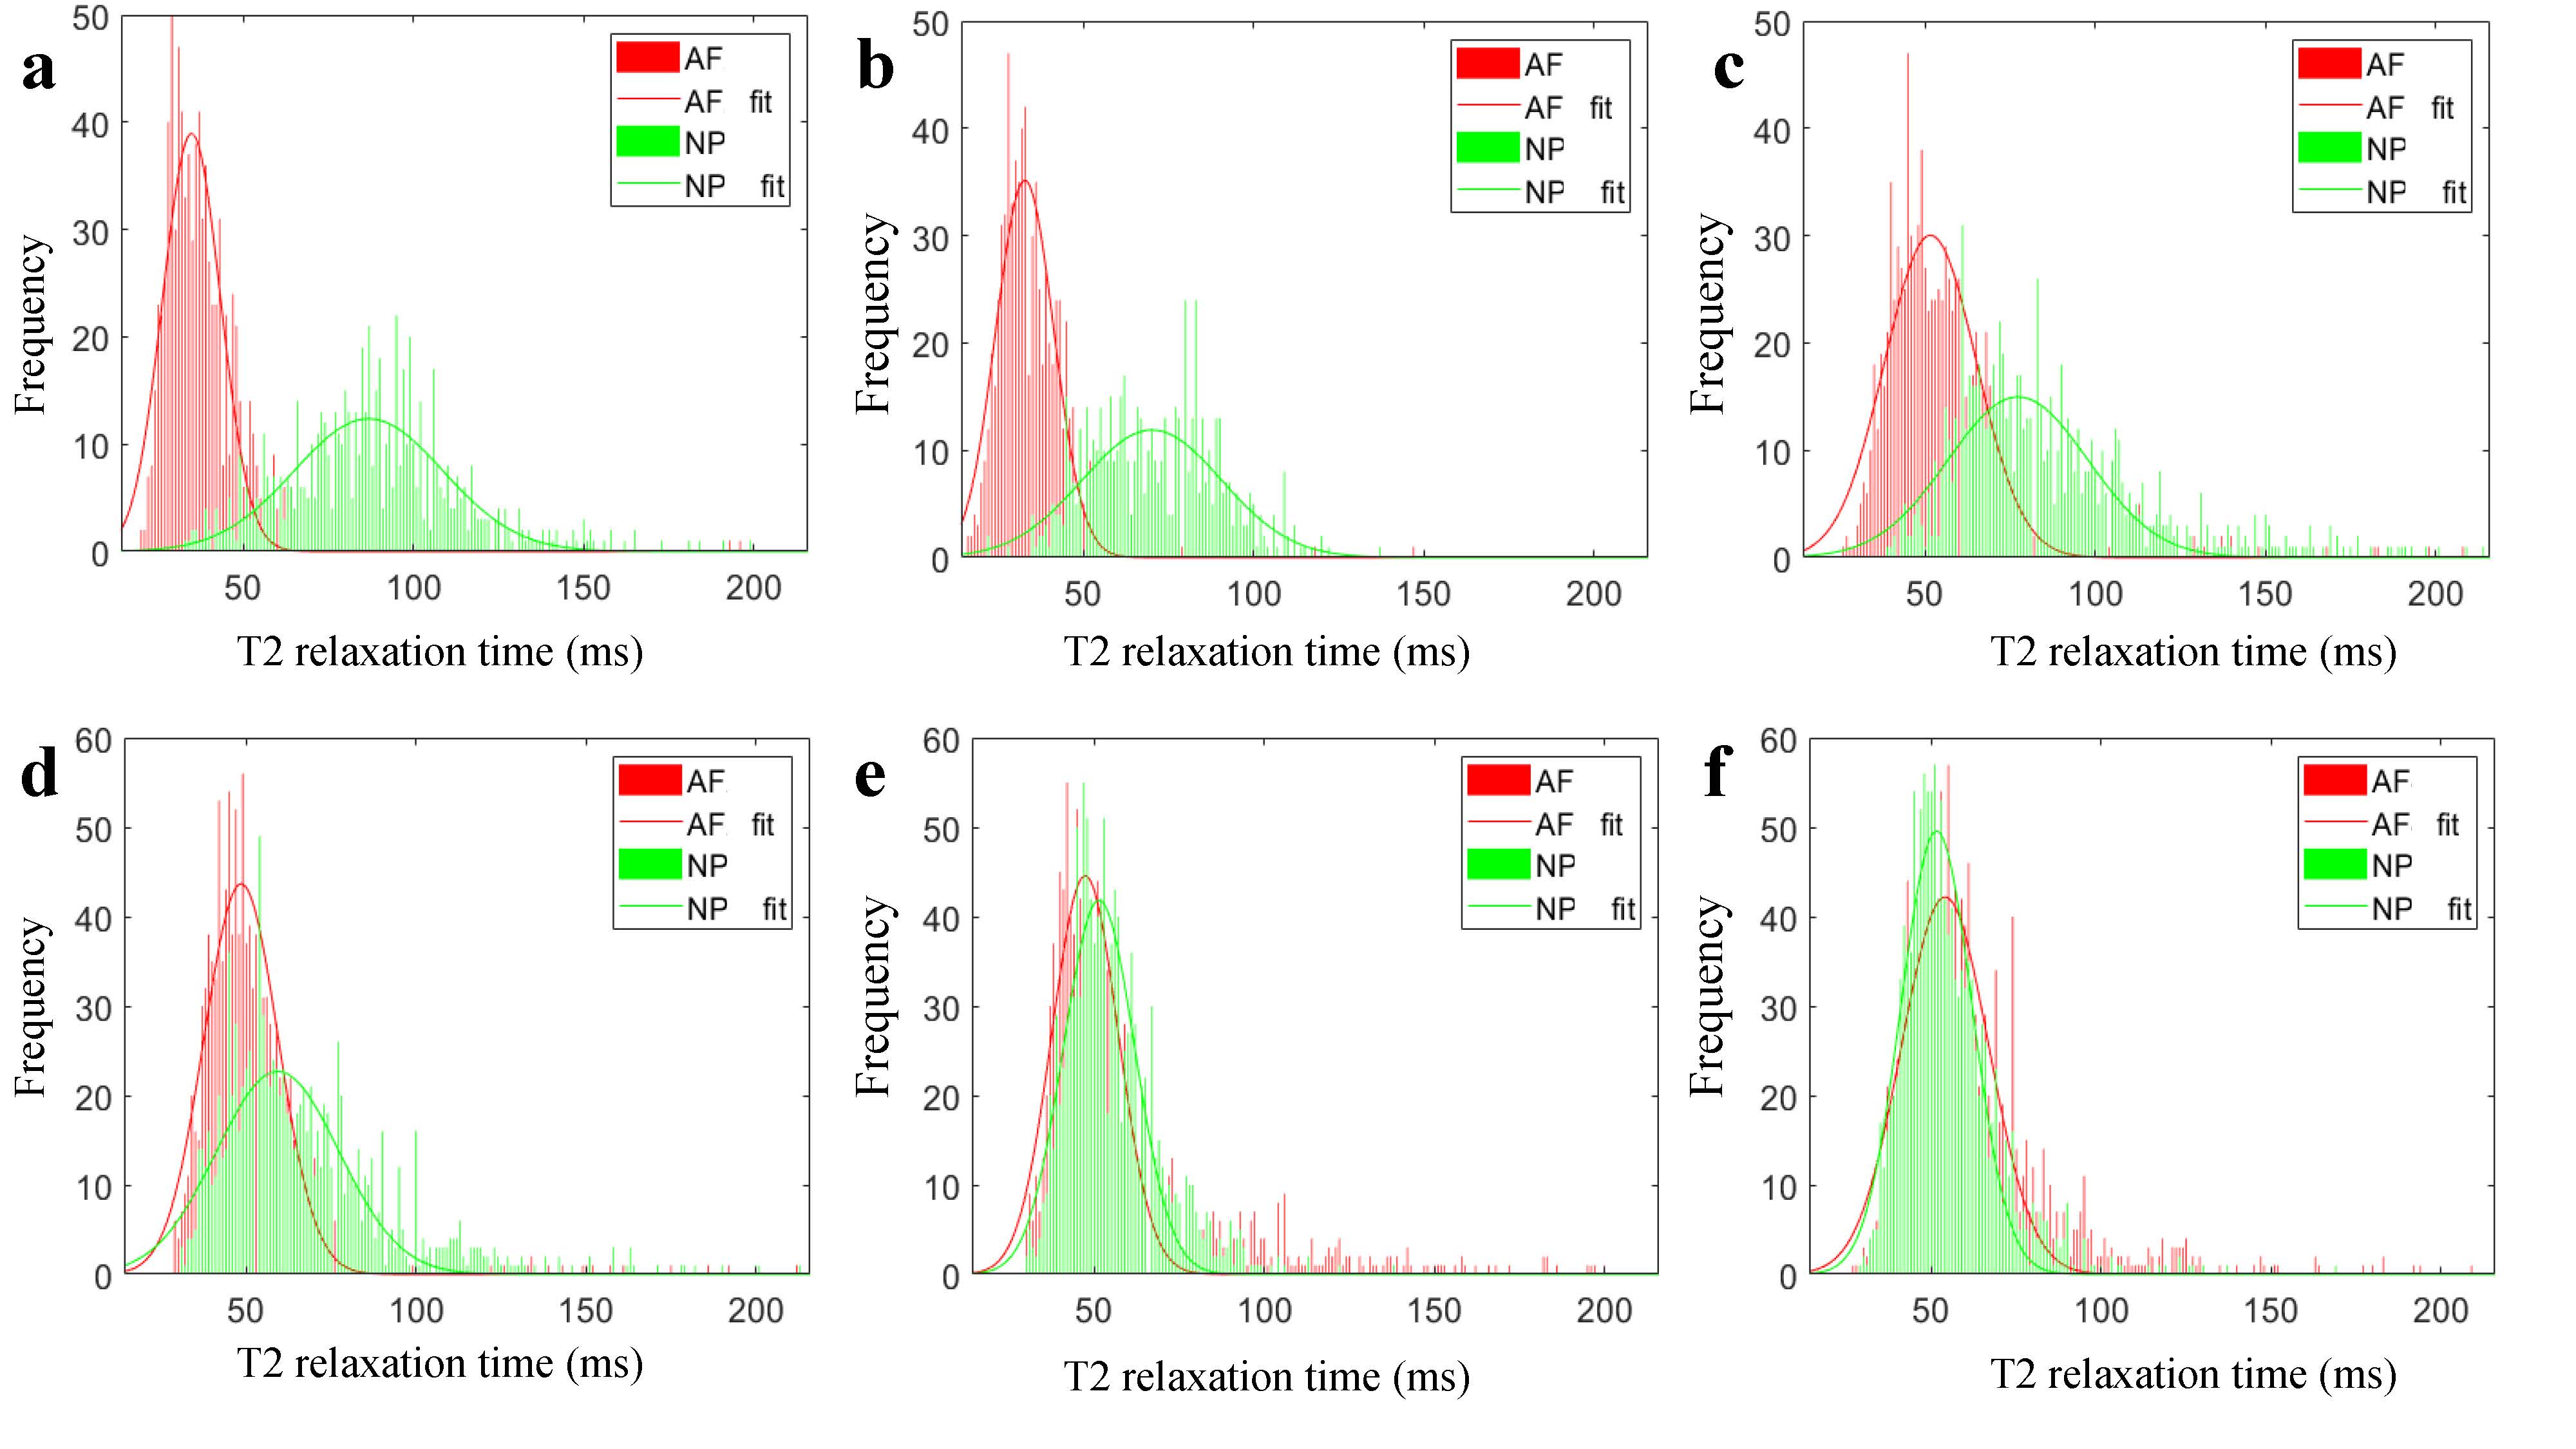
Figure.1 T2 histograms and Gaussian distributions of AF and NP.
a-e: Pfirrmann grade I-Ⅴ discs. The peak value of the NP gradually decreased and shifted towards the peak of the AF with the increasing grades.
f: The peak value of the NP was significantly lower than the AF of grade Ⅳ disc.
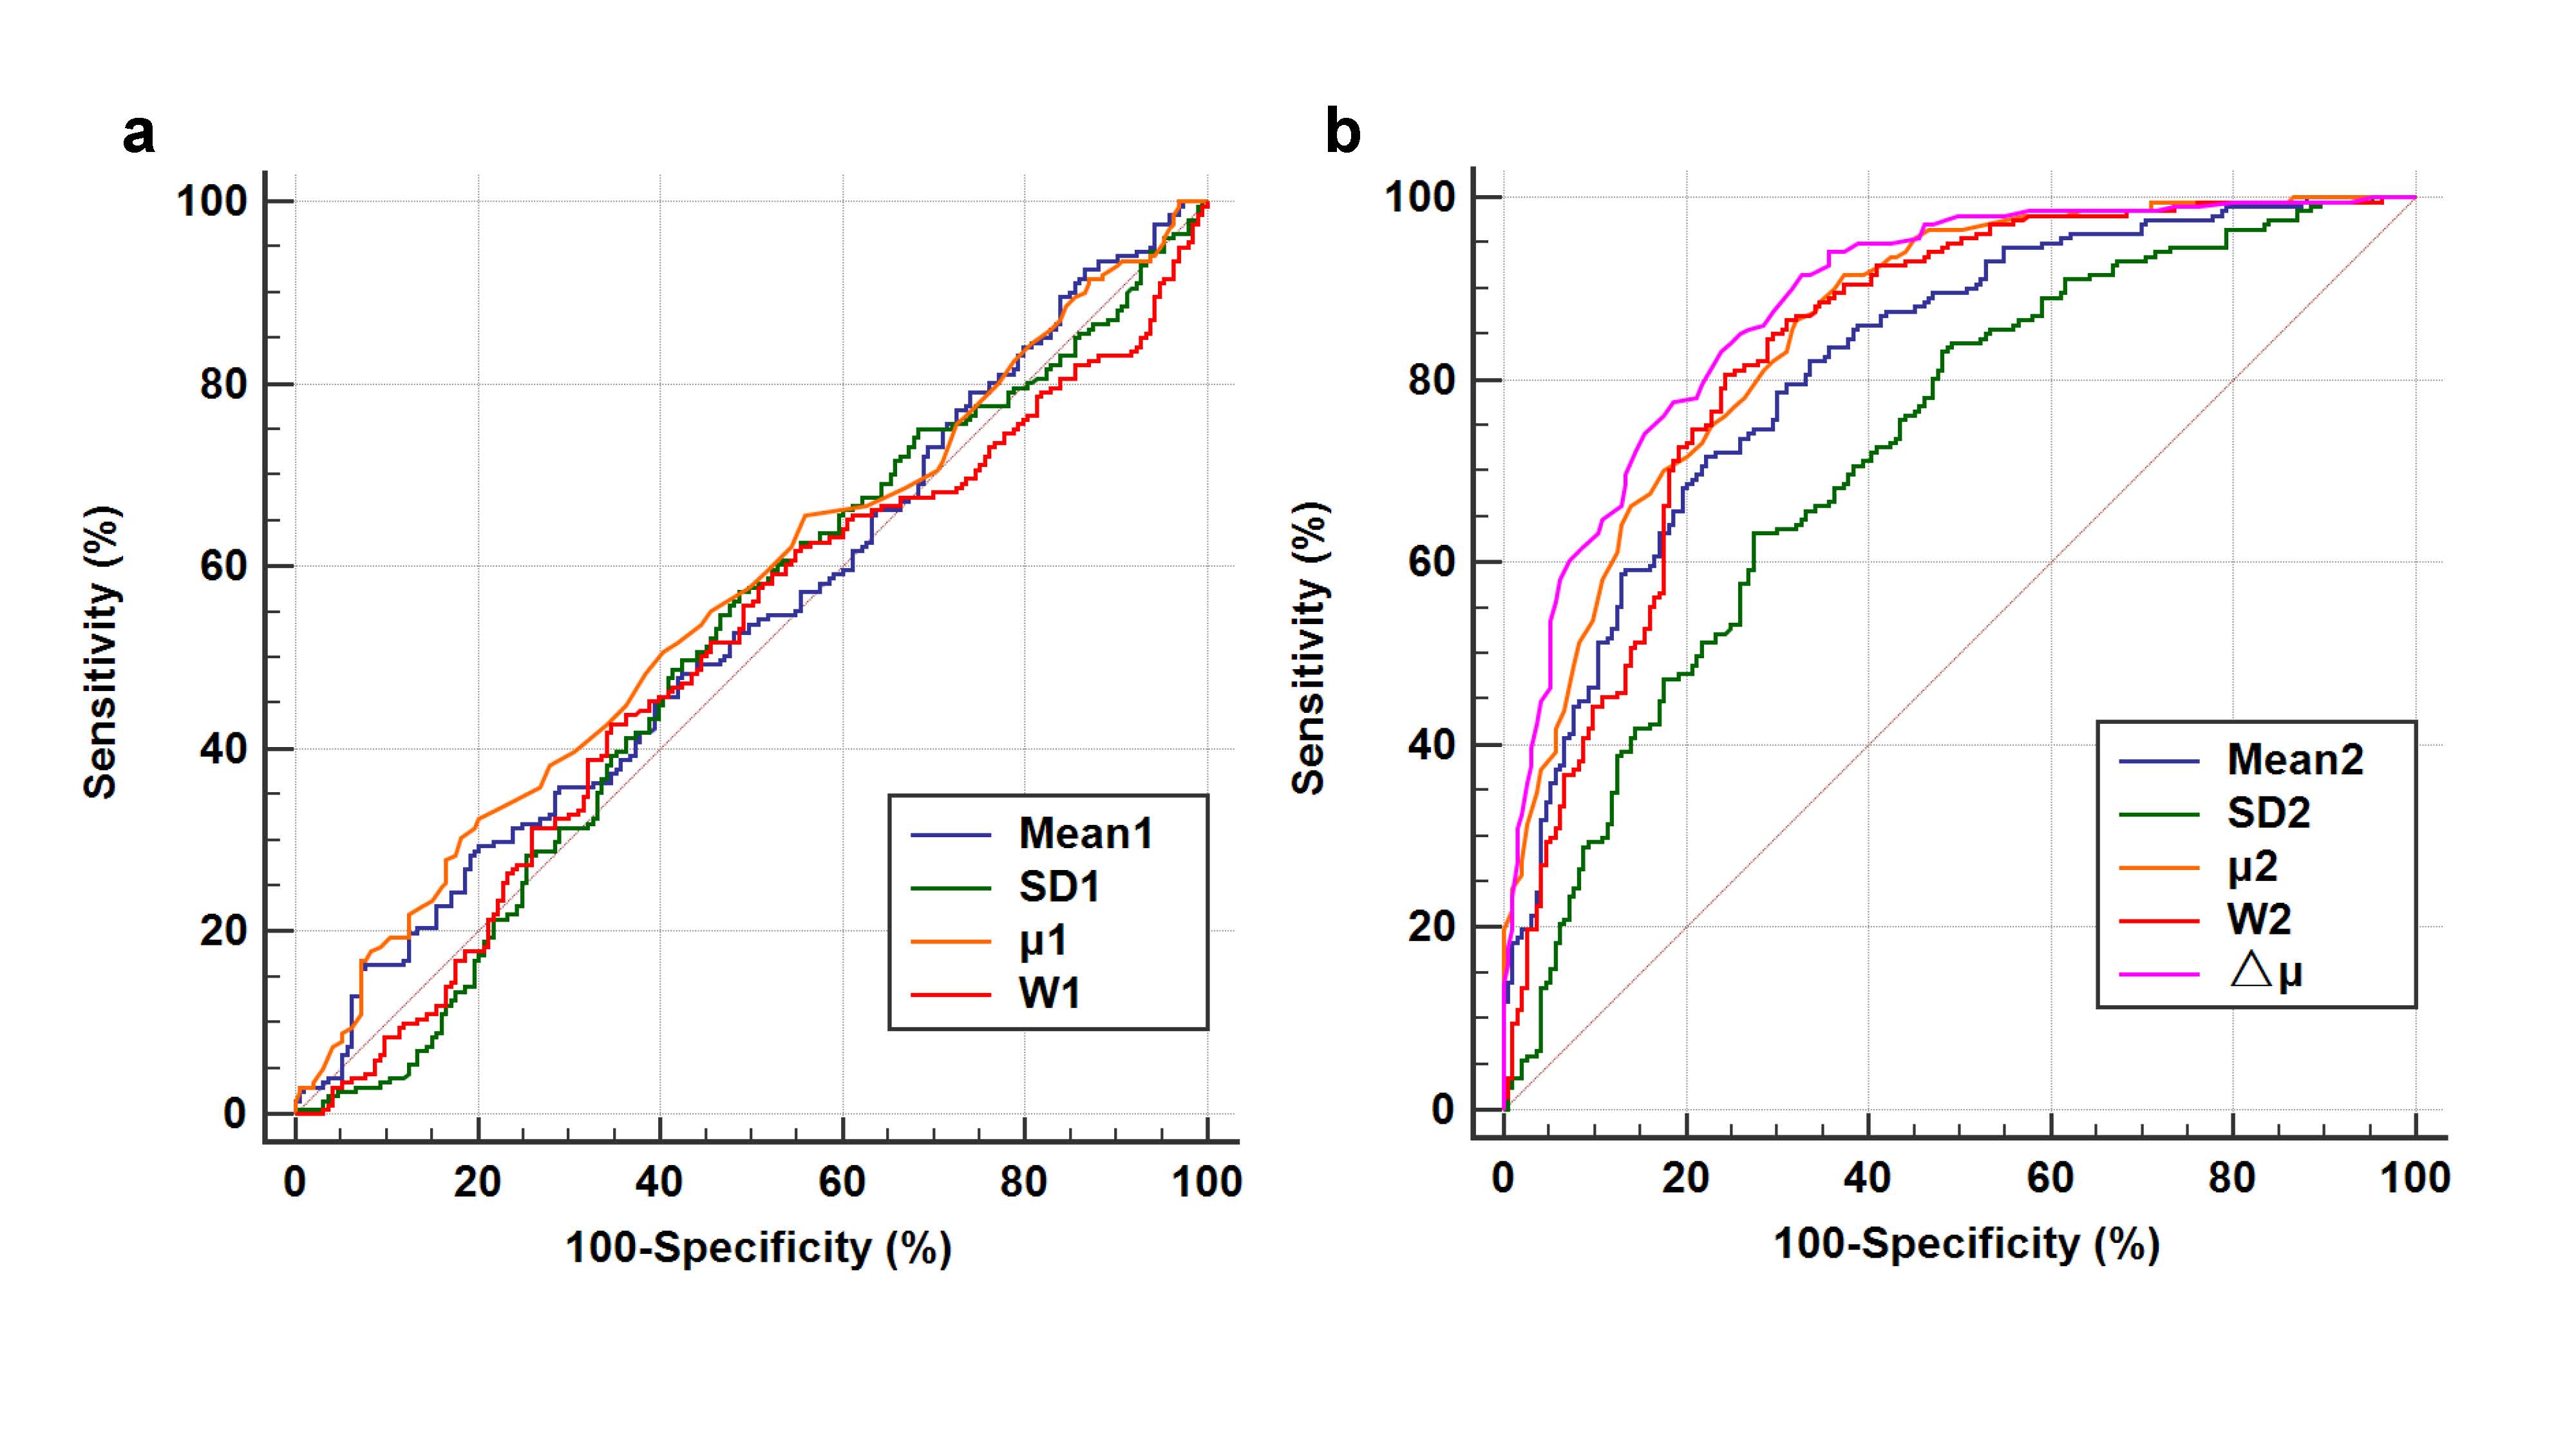
Figure.3 Receiver operating characteristic (ROC)
curves analysis of all
quantitative parameters
for distinguishing healthy discs from degeneration ones.