1Philips Healthcare, Copenhagen, Denmark, 2Danish Research Centre for Magnetic Resonance, Centre for Functional and Diagnostic Imaging and Research, Copenhagen University Hospital, Hvidovre, Denmark, 3Department of Radiology, University Medical Center Utrecht, Utrcecht, Netherlands, 4Section for Magnetic Resonance, DTU Health Tech, Technical University of Denmark, Kgs Lyngby, Denmark

Figure 4:
Simulated versus
measured dependency of MP-FLAIR image intensity to B1+. Dots: Measured MP-FLAIR intensities as a function of measured
DREAM B1+. Colors depict different RF gains. Other sources of signal loss
(e.g. B1-/B0, fluid-content) cause
the measured intensities to “fill out” the area under the curve.
Black line: Simulated FLAIR intensities. Increasing discrepancy
between simulation and measurements is seen below 60% and above 140% of B1+, which is ascribed to inherent bias in the measured B1+.
Red line: The MP-FLAIR
dependency to B1+ used for bias-field correction.
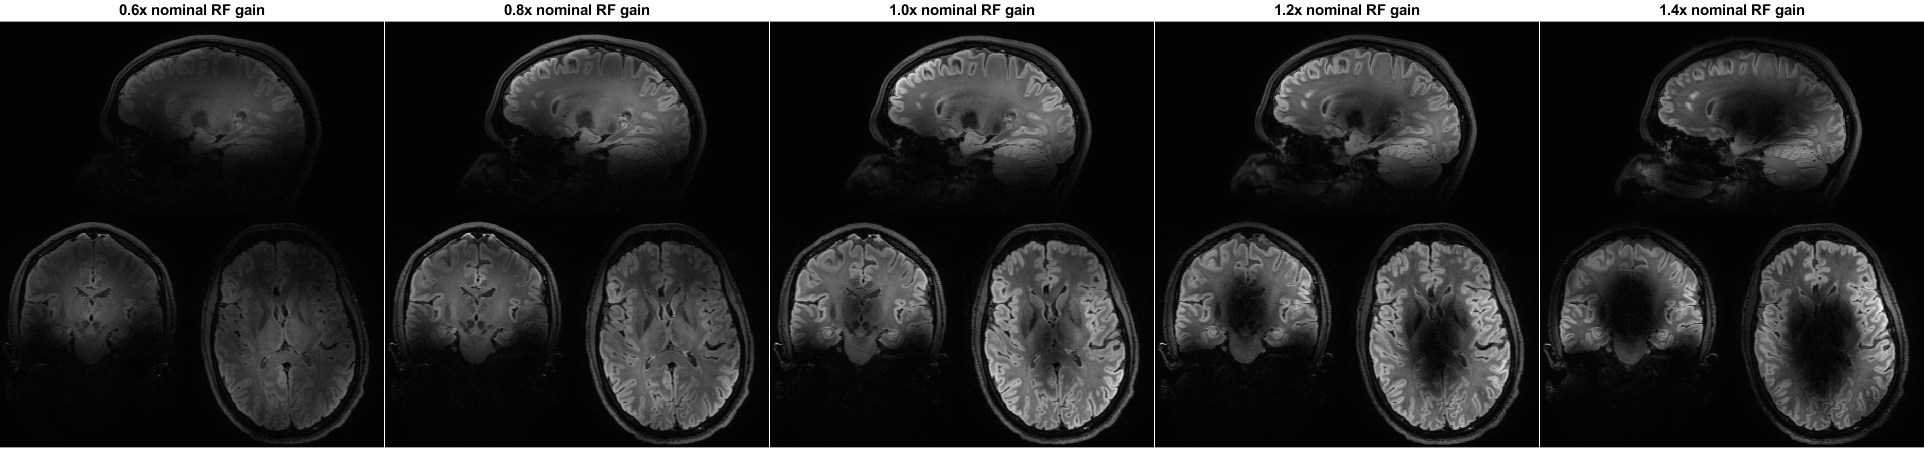
Figure 3:
5 repetitions of an MP-FLAIR scan with different
RF gains (0.6 – 1.4). For low RF gains, only the mid brain (where B1+ is
relatively large) experience close to nominal flip-angles. For RF gains higher
than 0.8, the mid brain shows as hypo-intense due to flip-angles being larger
than the nominal flip-angle. The lower occipital lobe (where B1+ is relatively
small), show as hypo-intense for all but the highest RF gain, where it
experiences close to nominal flip angles and shows as hyper-intense, due to the
surrounding tissue experiencing higher than nominal flip-angles.