1St. Paul's Hospital, UBC Centre for Heart Lung Innovation, Vancouver, BC, Canada, 2Division of Respiratory Medicine, Department of Medicine, University of British Columbia, Vancouver, BC, Canada, 3Robarts Research Institute, London, ON, Canada, 4Department of Medical Biophysics, Western University, London, ON, Canada
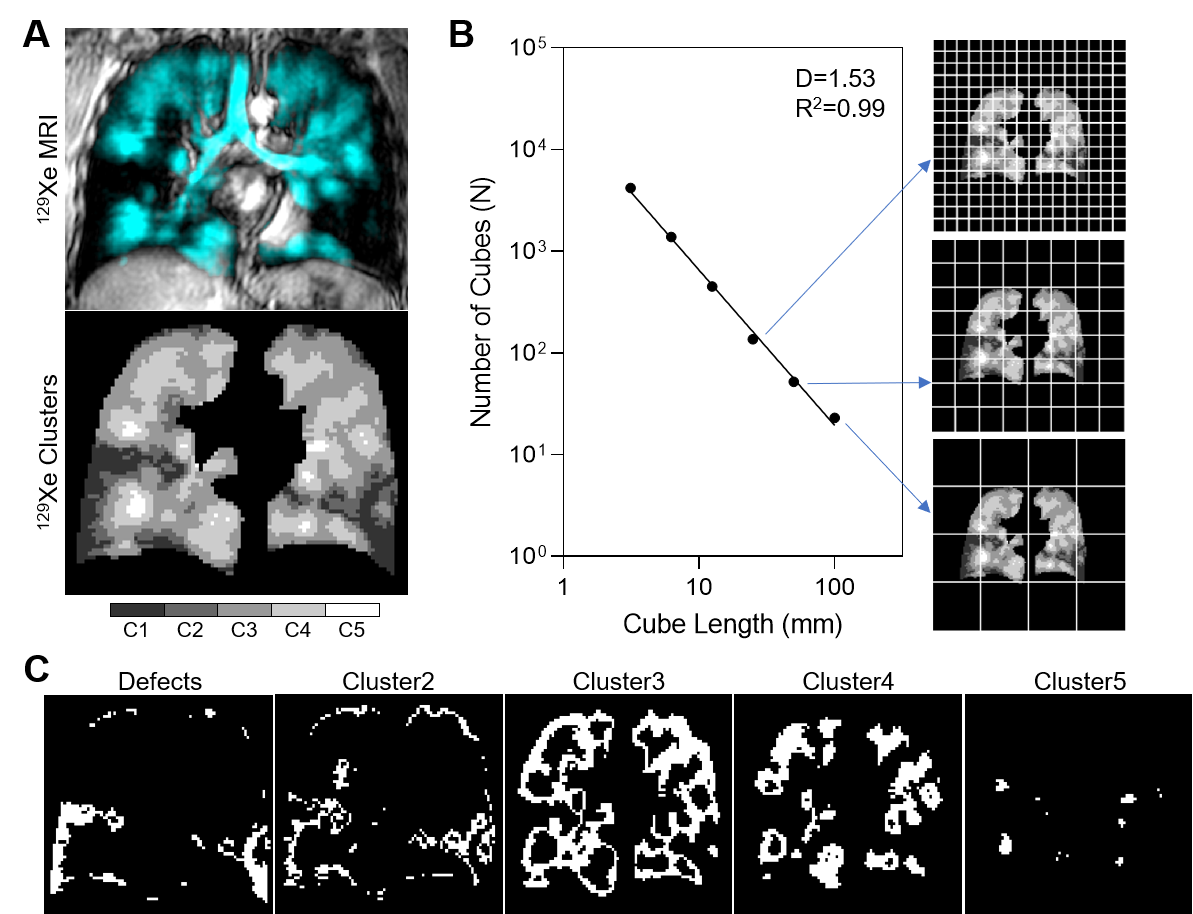
Figure 1. 129Xe MRI fractal analysis outline.
129Xe MRI static ventilation was segmented into 5 clusters of signal intensity ranging from signal void or ventilation defects to hyperintense signal (Cluster5) (A) and the box-counting method was used to calculate fractal dimension (B). Fractal dimension was calculated for each MRI signal intensity cluster (C).

Figure 2. 129Xe MRI fractal dimension measurements.
(A) Fractal dimension (D), R2 and root-mean-squared error (RMSE) for all MRI signal clusters. (B) 129Xe MRI ventilation (cyan) co-registered to anatomical 1H (grey-scale) for representative participants with asthma with associated fractal dimensions. (C) Log-log plots showing fractal dimensions for defect regions (Cluster1), Cluster2 and Cluster4 for representative participants.