Constance J Mietus1, Yue Gao1, Mariano G Uberti2, Nicholas G Lambert1, Panagiotis Koutakis3, Evlampia Papoutsi3, Jonathan R Thompson1, Holly K DeSpiegelaere4, Michael D Boska2, Sara A Myers5, George P Casale1, Iraklis I Pipinos1,4, and Balasrinivasa R Sajja2
1Department of Surgery, University of Nebraska Medical Center, Omaha, NE, United States, 2Department of Radiology, University of Nebraska Medical Center, Omaha, NE, United States, 3Department of Biology, Baylor University, Waco, TX, United States, 4Department of Surgery and VA Research Service, VA Nebraska-Western Iowa Health Care System, Omaha, NE, United States, 5Department of Biomechanics, University of Nebraska Omaha, Omaha, NE, United States
1Department of Surgery, University of Nebraska Medical Center, Omaha, NE, United States, 2Department of Radiology, University of Nebraska Medical Center, Omaha, NE, United States, 3Department of Biology, Baylor University, Waco, TX, United States, 4Department of Surgery and VA Research Service, VA Nebraska-Western Iowa Health Care System, Omaha, NE, United States, 5Department of Biomechanics, University of Nebraska Omaha, Omaha, NE, United States
Alterations
of T1 and T2 relaxation times are linked to the hemodynamic decline (ABI,
ischemic window) and ambulatory impairment (peak plantar flexion, claudication
onset time, peak walking time) of patients with Peripheral Artery Disease.
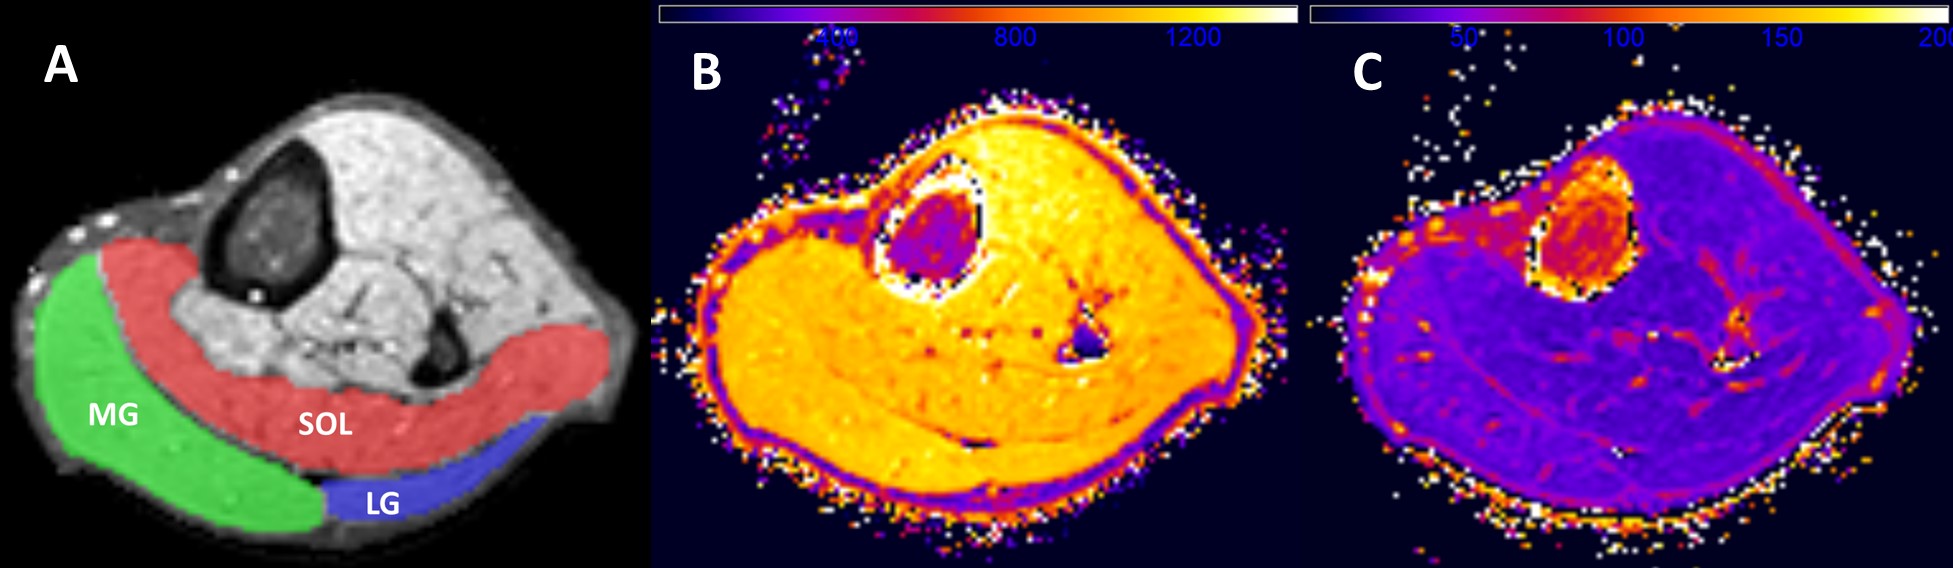
Figure
1: A) Overlay of manually drawn regions on T2-weighted cross-section. B & C)
Corresponding T1 and T2 relaxation time maps.
MG = medial gastrocnemius, LG = lateral gastrocnemius, and SOL = soleus
muscle regions.
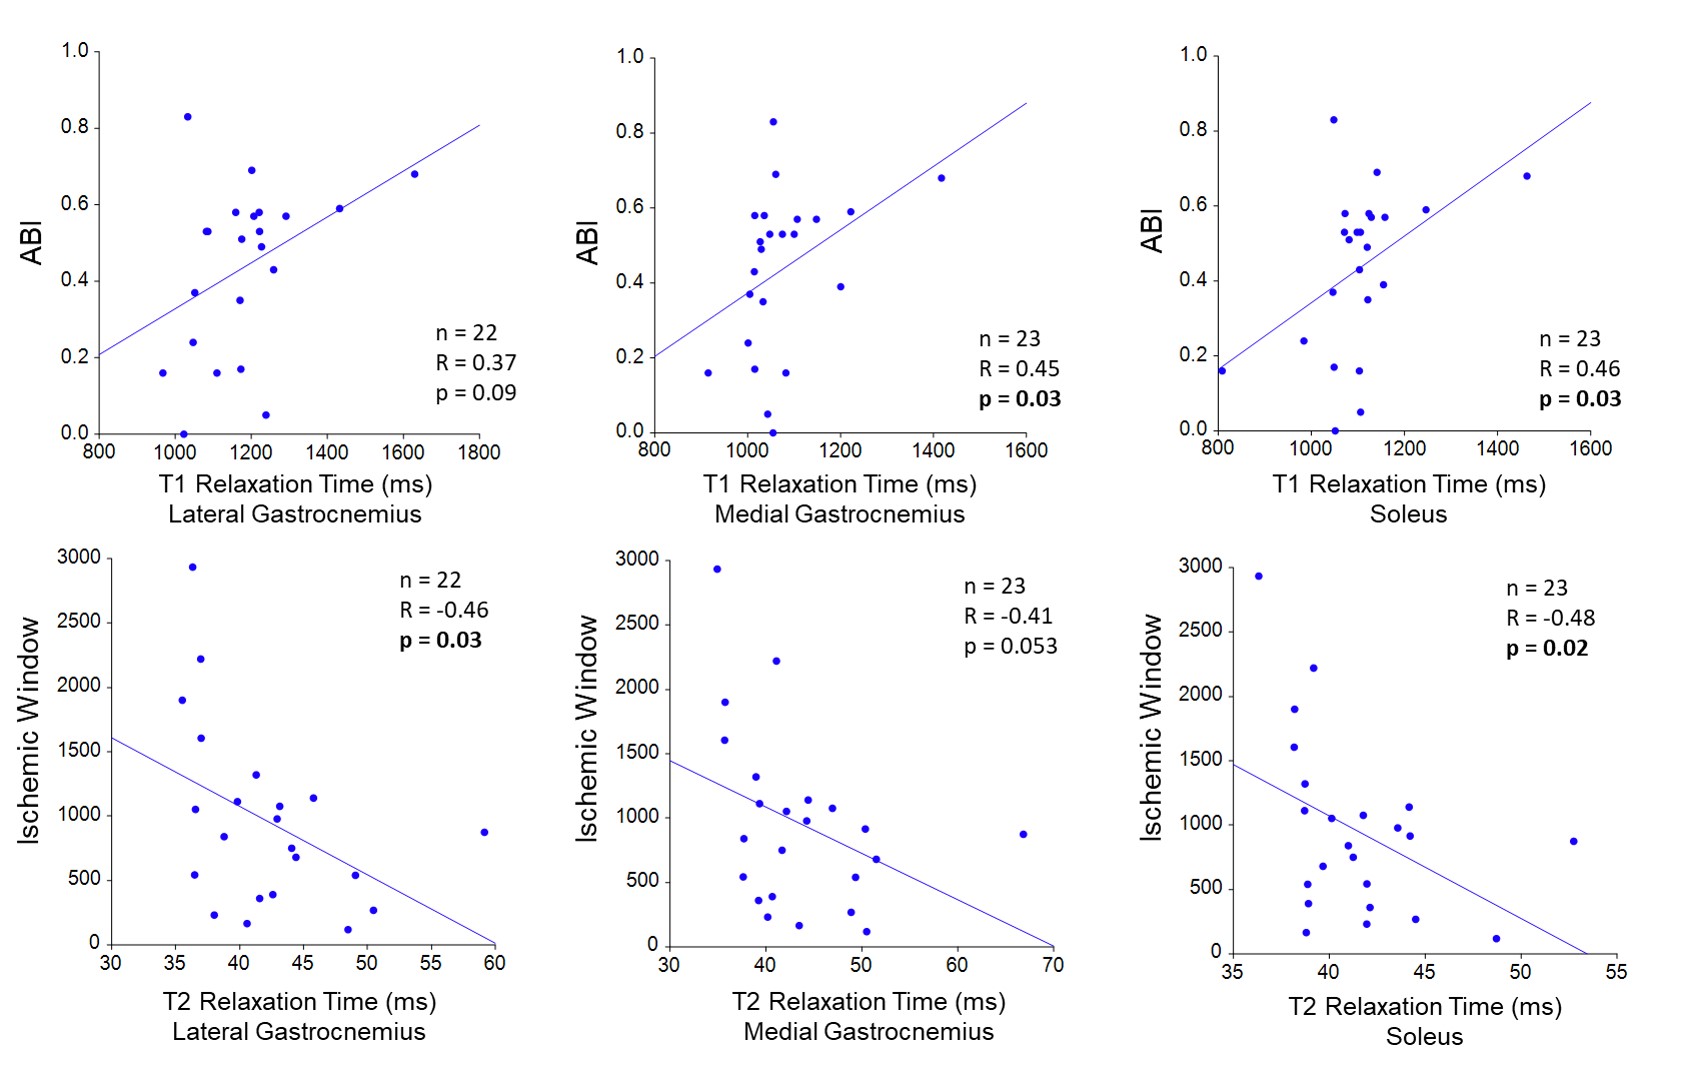
Figure 2: Ankle Brachial Index (ABI) is positively
correlated with T1 relaxation time in the medial gastrocnemius and soleus (upper panel). Decreasing ABI reflects
worsening arterial blockages. Ischemic
window is negatively correlated with T2 relaxation time in the soleus and
lateral gastrocnemius (lower panel). Increasing ischemic window reflects worsening
arterial blockages.