Gao Eryuan1, Gao Ankang1, Zhang Huiting2, Wang Shaoyu2, Yan Xu2, Bai Jie1, and Cheng Jingliang1
1Dept. of MRI, The First Affiliated Hospital of Zhengzhou University, Zhengzhou, China, Zhengzhou, China, 2MR Scientific Marketing, Siemens Healthcare, Shanghai, China, Shanghai, China
1Dept. of MRI, The First Affiliated Hospital of Zhengzhou University, Zhengzhou, China, Zhengzhou, China, 2MR Scientific Marketing, Siemens Healthcare, Shanghai, China, Shanghai, China
Histogram Analysis based on multiple diffusion
models was helpful in glioma grading., especially for the maximum values of DTI and MAP methods.
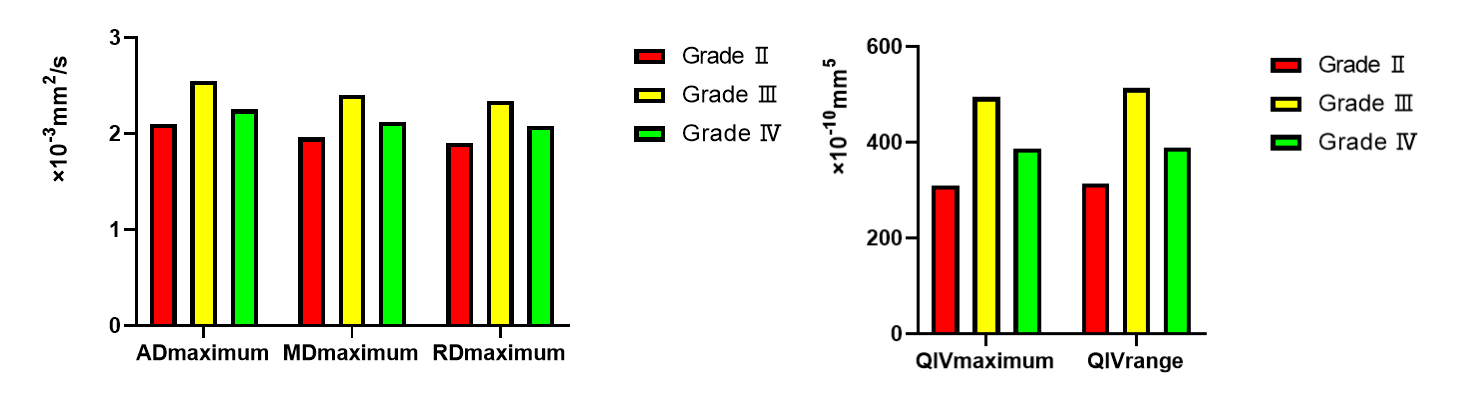
Fig.
1. Bar
graphs of ADmaximum, MDmaximum, RDmaximum, QIVmaximum
and QIVrange values averaged across grade Ⅱ (n=33), grade Ⅲ (n=11) and grade Ⅳ (n=54) gliomas. All parameters are significant with P<0.05.
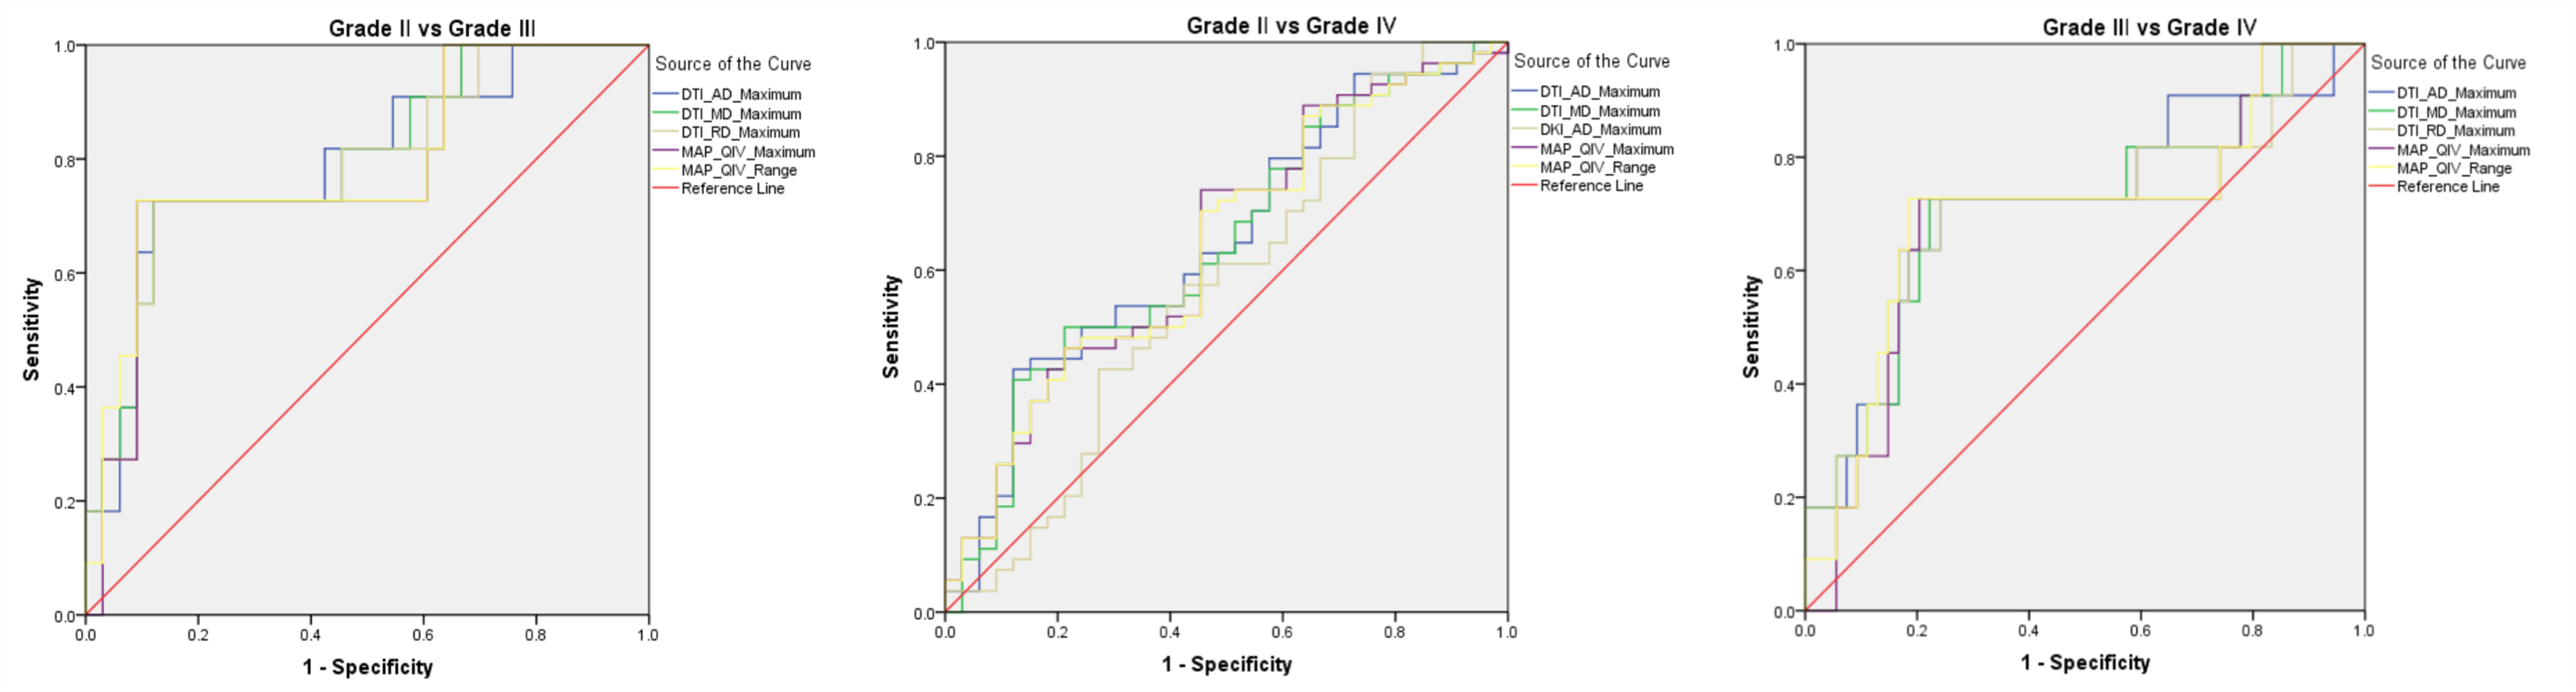
Fig.
2. ROC analysis for ADmaximum, MDmaximum,
RDmaximum, QIVmaximum and QIVrange in three
comparisons (GradeⅡ VS GradeⅢ, GradeⅡVS Grade Ⅳ and GradeⅢ VS Grade Ⅳ)