Jan Brabec1, Filip Szczepankiewicz2, Jaromír Šrámek3, Elisabet Englund4, Johan Bengzon5, Linda Knutsson1,6, Carl-Fredrik Westin7,8, Pia C Sundgren2,9, and Markus Nilsson2
1Medical Radiation Physics, Lund University, Lund, Sweden, 2Diagnostic Radiology, Lund University, Lund, Sweden, 3Institute of Histology and Embryology, First Faculty of Medicine, Charles University, Prague, Czech Republic, 4Division of Oncology and Pathology, Department of Clinical Sciences, Lund University, Lund, Sweden, 5Division of Neurosurgery, Department of Clinical Sciences, Lund University, Lund, Sweden, 6Russell H. Morgan Department of Radiology and Radiological Science, Johns Hopkins University School of Medicine, Baltimore, MD, United States, 7Harvard Medical School, Boston, MA, United States, 8Radiology, Brigham and Women’s Hospital, Boston, MA, United States, 9Lund University Bioimaging Center, Lund University, Lund, Sweden
1Medical Radiation Physics, Lund University, Lund, Sweden, 2Diagnostic Radiology, Lund University, Lund, Sweden, 3Institute of Histology and Embryology, First Faculty of Medicine, Charles University, Prague, Czech Republic, 4Division of Oncology and Pathology, Department of Clinical Sciences, Lund University, Lund, Sweden, 5Division of Neurosurgery, Department of Clinical Sciences, Lund University, Lund, Sweden, 6Russell H. Morgan Department of Radiology and Radiological Science, Johns Hopkins University School of Medicine, Baltimore, MD, United States, 7Harvard Medical School, Boston, MA, United States, 8Radiology, Brigham and Women’s Hospital, Boston, MA, United States, 9Lund University Bioimaging Center, Lund University, Lund, Sweden
Cellularity poorly explains intra-tumor variability of mean diffusivity on mesoscopic scale in meningiomas. Other microstructural features such as microcysts, macrocysts, vessels, psammoma bodies, collagen fibers or need to be considered.
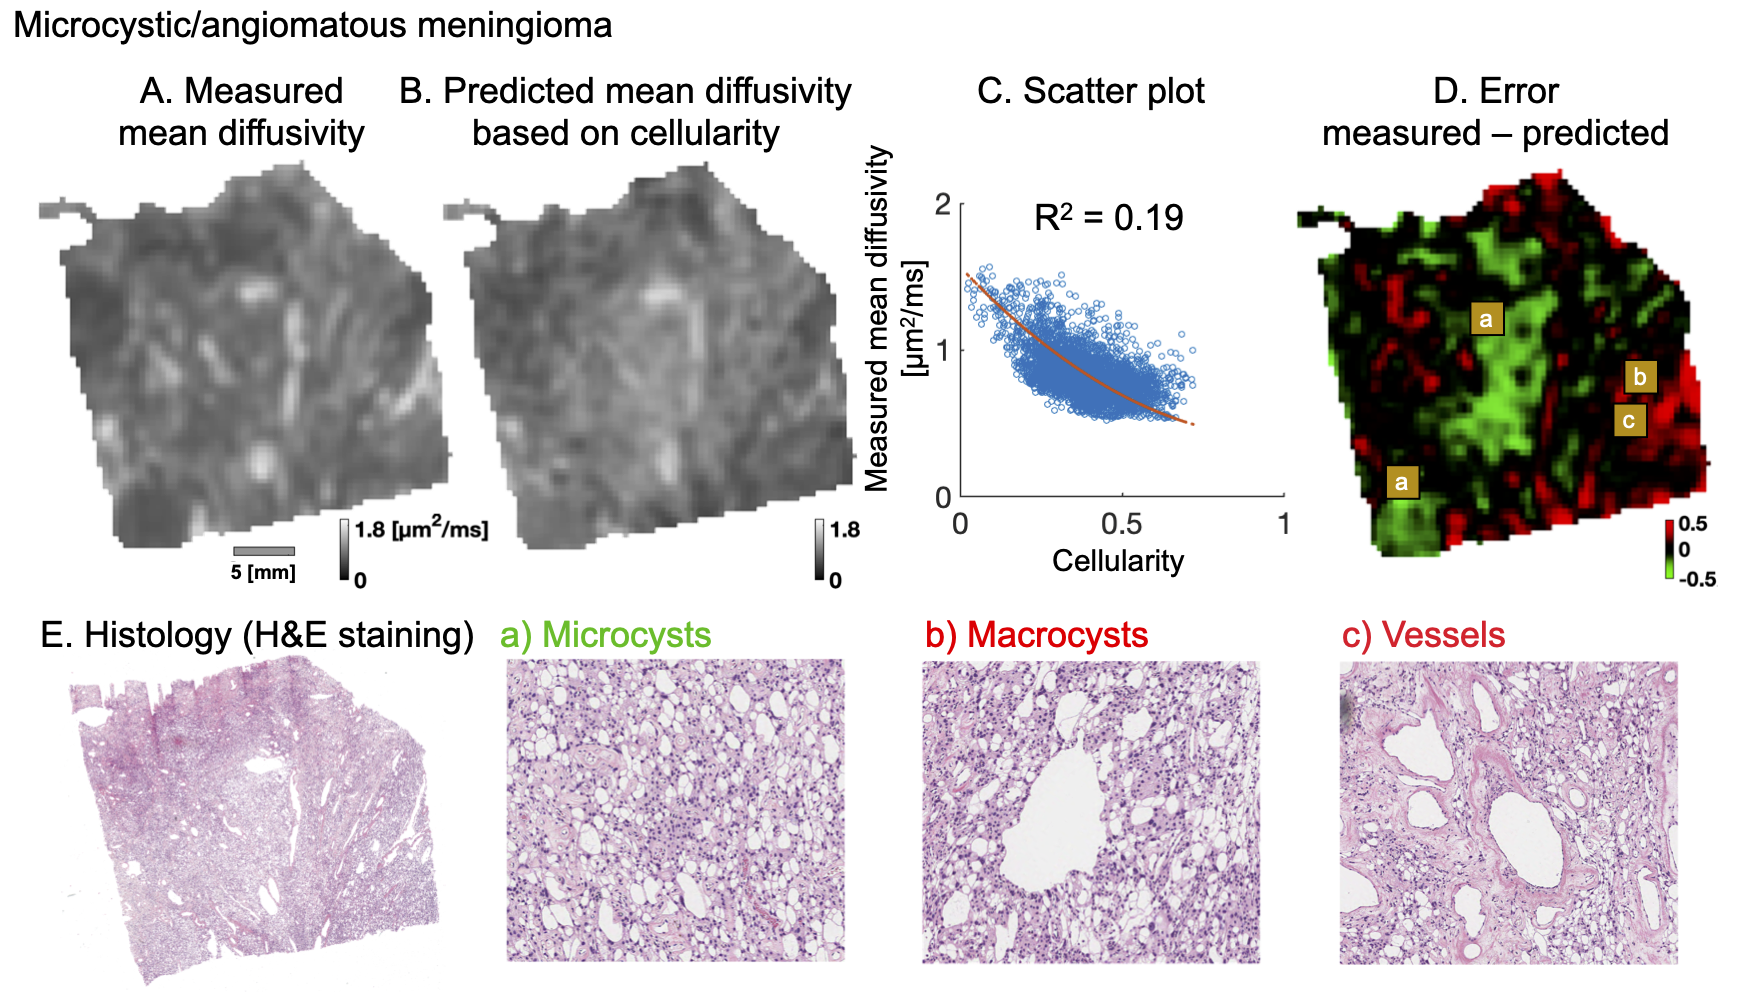
Figure 1. Analysis of microcystic/angiomatous meningioma. The upper row shows measured (A) and predicted mean diffusivity based on cellularity (B): a second-degree polynomial yielded R2 of 0.19 (C). The error map (D) shows large negative (green area) and positive (red) errors where the predicted diffusivity is over/under-estimated. Overestimation was related to high prevalence of microcysts (a; bottom row) because these provide restrictions. Underestimation was found in regions that contained macrocysts and vessels (b and c) because these provide free water compartments.
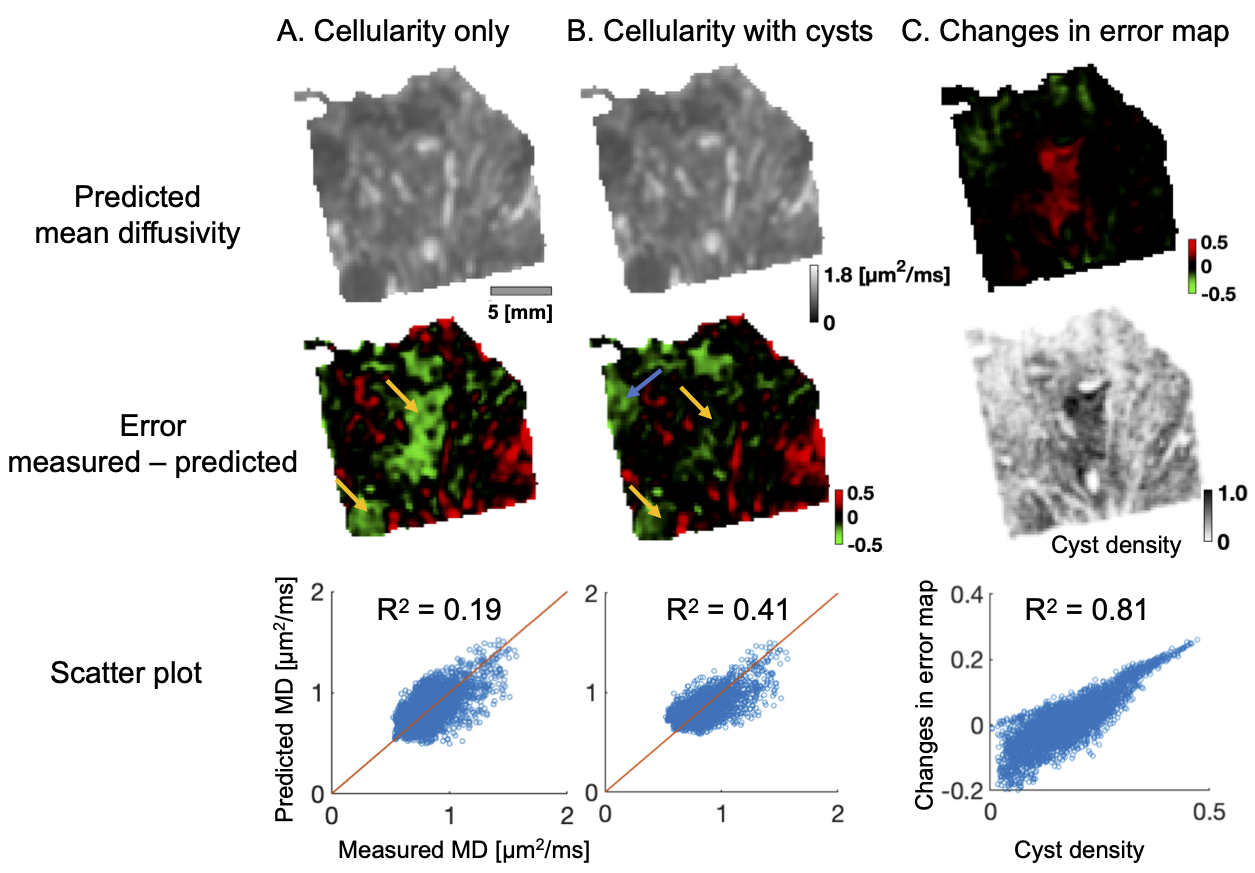
Figure 3. Quantitative analysis. Part A shows predicted diffusivity omitting and part B including microcysts. The error maps reveal large systematic error areas (yellow arrows) that disappears when cysts are included in the fit already as an additional linear term. In addition, R2 increases from 0.19 to 0.41. The blue part marks newly emerged error area that was not previously there. Part C highlights the changes in the error maps. The changes are strongest in the middle part where the cyst density is also the highest. The changes overall strongly correlate with cyst density (R2 = 0.81).