Anmol Monga1, Dimitri Martel1, Stephen Honig2, and Gregory Chang1
1Department of Radiology, NYU Langone Health, New York, NY, United States, 2Osteoporosis Center, Hospital for Joint Disease, NYU Langone Health, New York, NY, United States
1Department of Radiology, NYU Langone Health, New York, NY, United States, 2Osteoporosis Center, Hospital for Joint Disease, NYU Langone Health, New York, NY, United States
Radiomic features calculated on Fat parametric maps explains variability in Bone Mineral Density to higher extend than water and fat fraction parametric maps.

Figure 1: Reconstructed fat, water and PDFF maps using IDEAL and mask used for radiomic
computation.
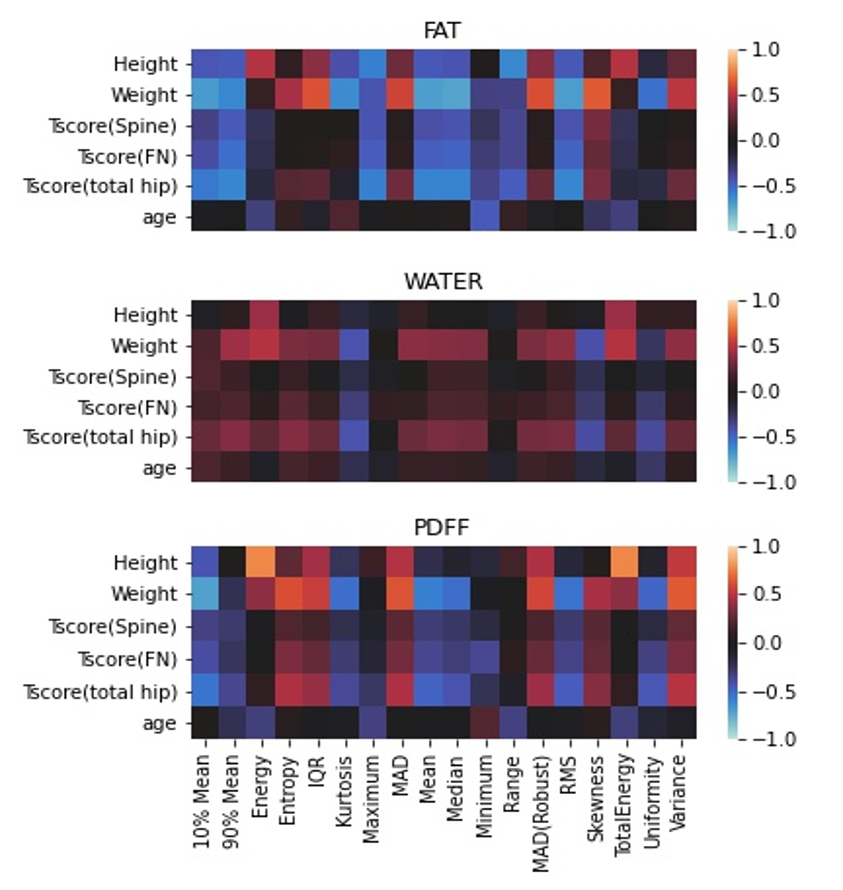
Figure 2: Correlation of first order
radiomic features with clinical features and T-score (spine, hip, femoral neck) calculated on fat, water and PDFF maps.
IQR: Interquartile range, MAD:
Mean absolute deviation, RMS: Root Mean Squared.