Xin Li1, Eric M. Baker1, Brendan Moloney1, Ryan P. Kopp2, Fergus V. Coakley3, Mark G. Garzotto4, and Charles S. Springer1
1Advanced Imaging Research Center, Oregon Health & Science University, Portland, OR, United States, 2Urology, Oregon Health & Science University, Portland, OR, United States, 3Radiology, Oregon Health & Science University, Portland, OR, United States, 4Urology, Portland VA Center, Portland, OR, United States
1Advanced Imaging Research Center, Oregon Health & Science University, Portland, OR, United States, 2Urology, Oregon Health & Science University, Portland, OR, United States, 3Radiology, Oregon Health & Science University, Portland, OR, United States, 4Urology, Portland VA Center, Portland, OR, United States
The first metabolic and cytometric maps of human prostate cancer are presented. A Gleason (3+4) tumor has very conspicuous elevated cell density and reduced average cell density, and depressed homeostatic Sodium Pump enzymatic turnover.
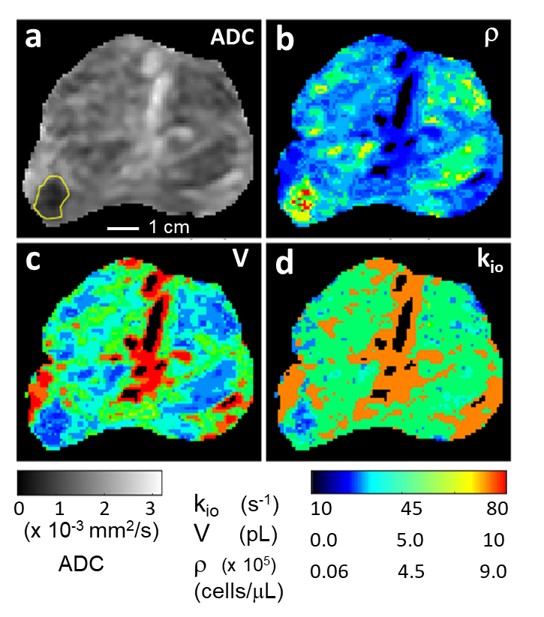
Figure 1. Prostate axial ADC (a), ρ (b), V (c), and kio (d) maps; inferior perspective. The GS (3+4) lesion is bordered in yellow (a). [Pixels in urethra and ductule-rich regions are colored black in (b), (c), and (d).] The ρ, V, maps are in near absolute quantitative agreement with estimations from published ex vivo histopathology and the r map shows very high in vivo lesion/NA prostate gland conspicuity. The kio map indicates lower metabolic activity in the lesion. The r and V maps may suggest nascent pathology in NA prostate regions, particularly the peripheral zone (see text).