1Département de médecine nucléaire et radiobiologie, Université de Sherbrooke, Sherbrooke, QC, Canada, 2Département de pédiatrie, Université de Sherbrooke, Sherbrooke, QC, Canada, 3Département de radiologie diagnostique, Université de Sherbrooke, Sherbrooke, QC, Canada

A) Whole-brain CBF pre and post GAHT treatment in participant 1.
B) Whole-brain CBF pre and post GAHT treatment in participant 2.
C) Percent change in average whole-brain CBF. Note that percent change in CBF appears to be of the same magnitude as the change in Serum T shown in D.
D) Percent change in Serum T.
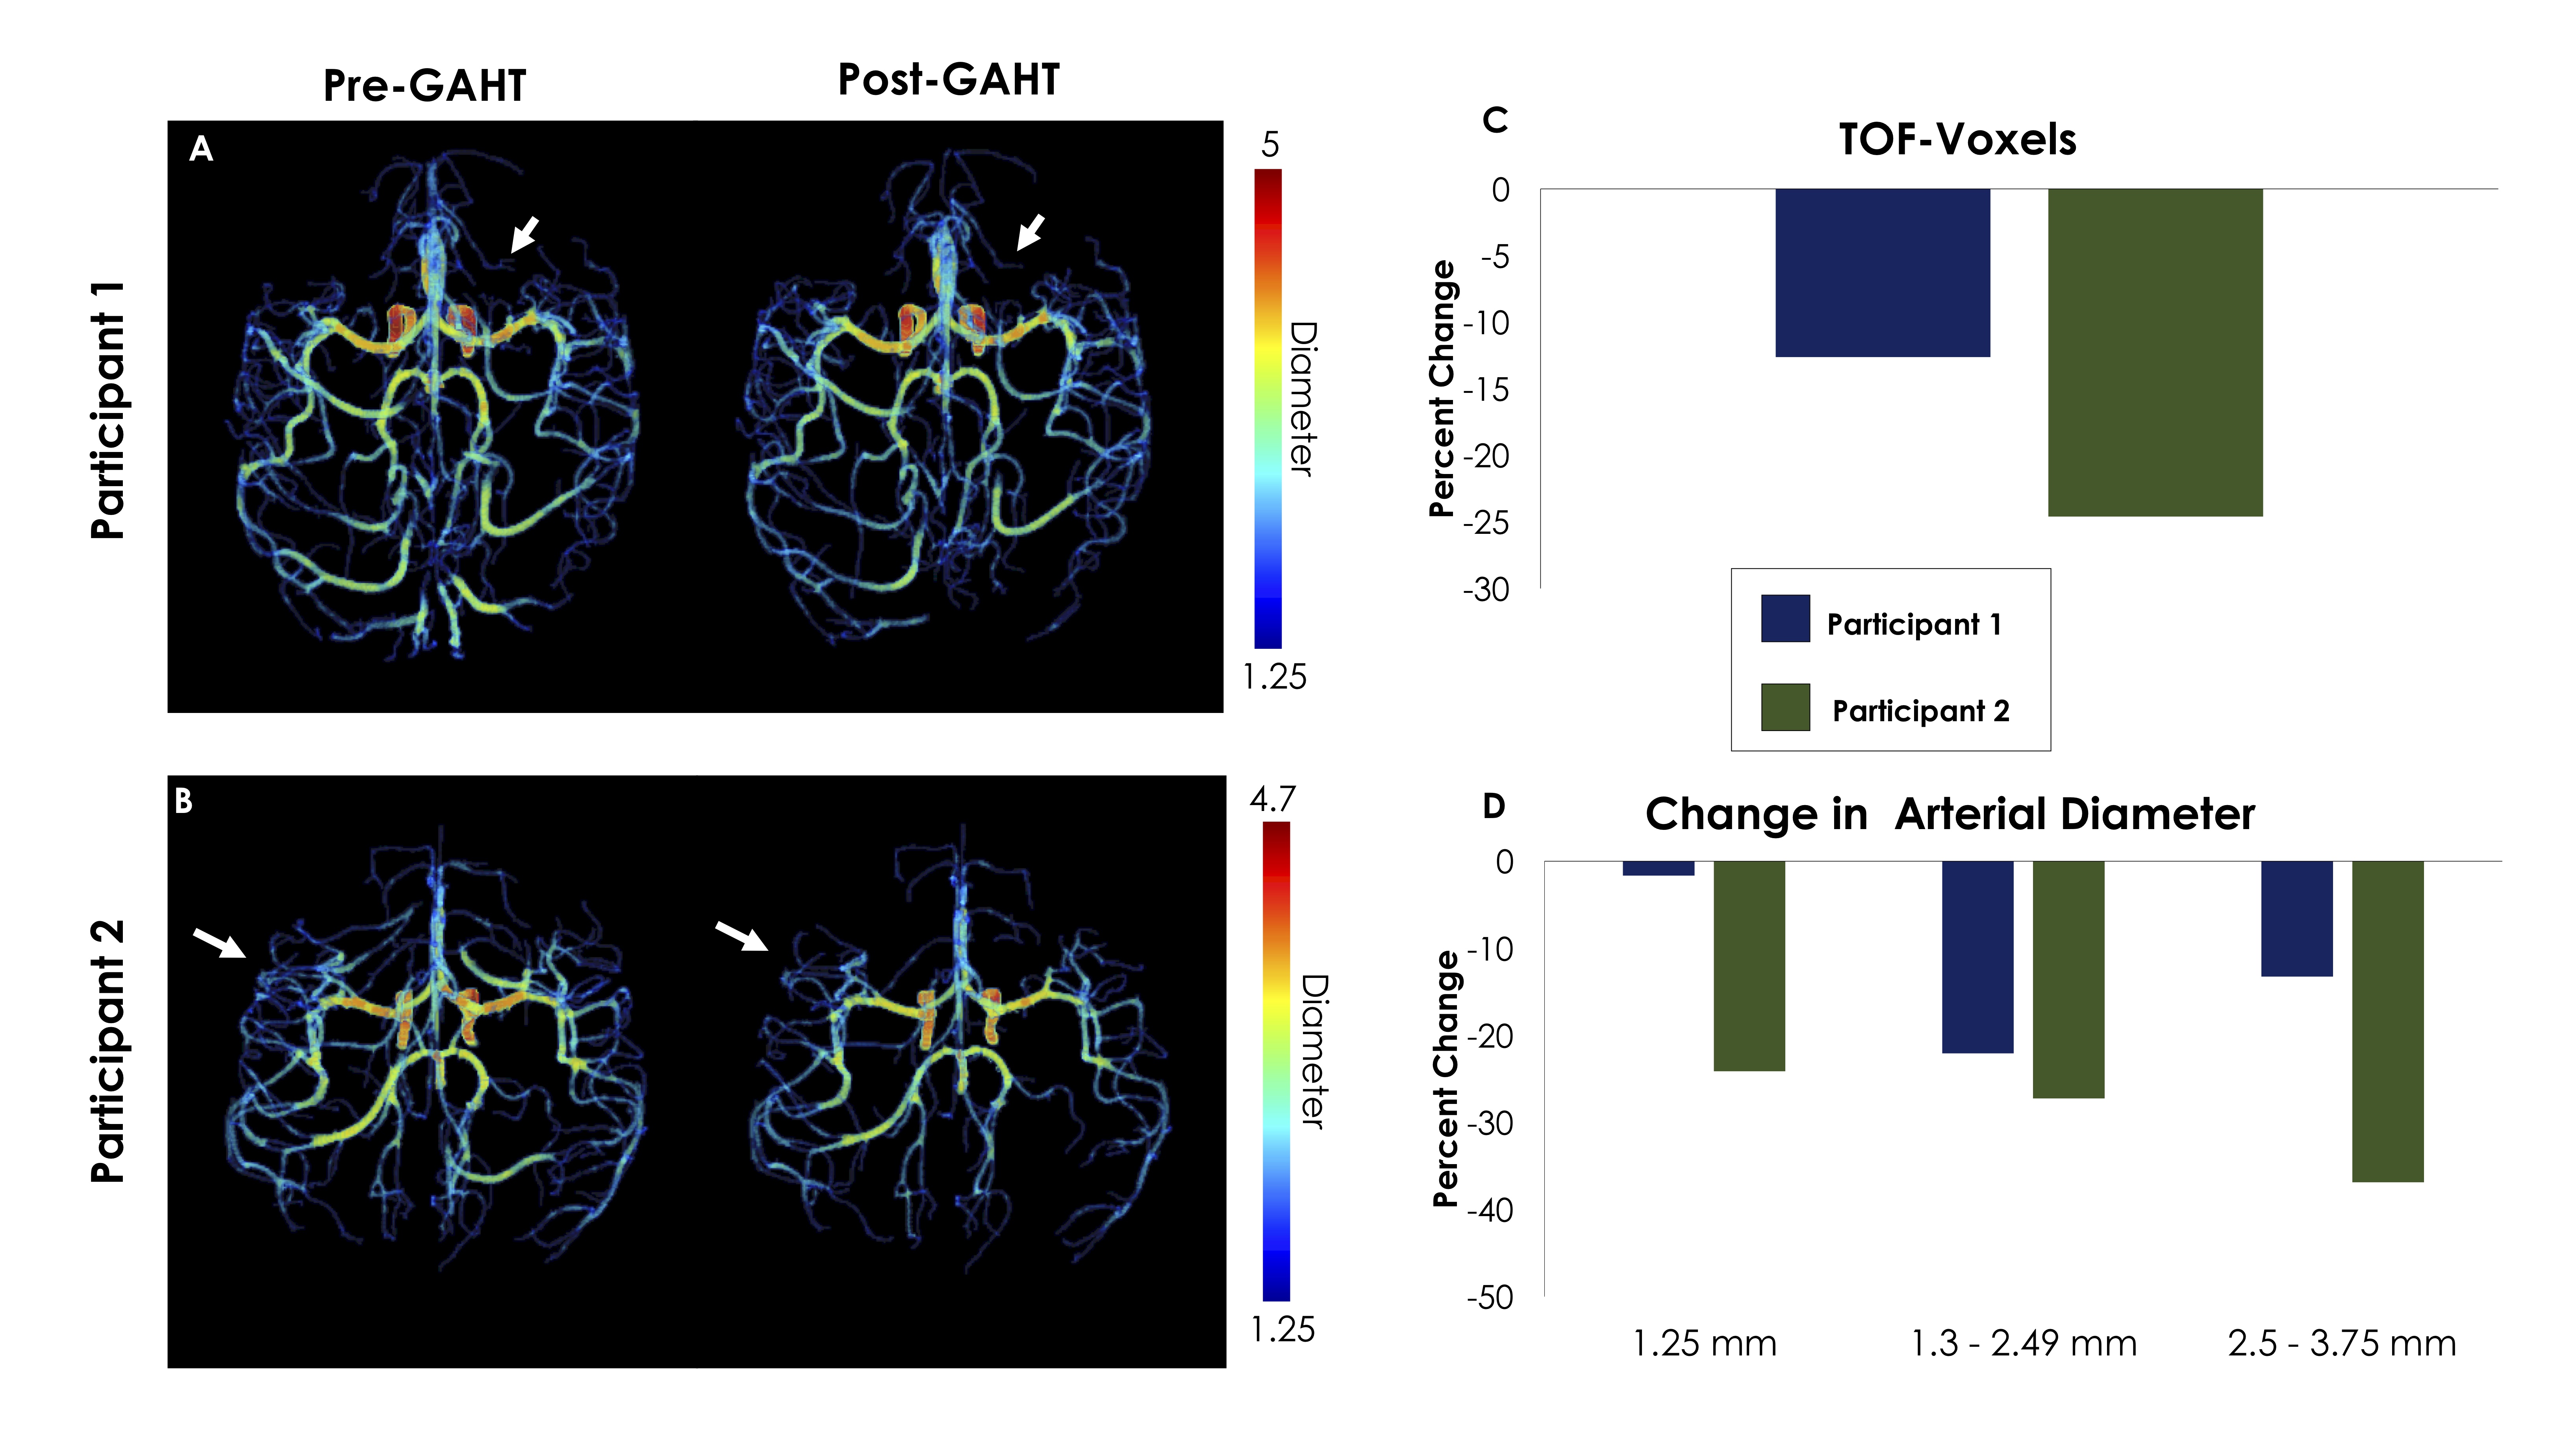
A) 3D projection of segmented vascular tree, with diameter values in participant 1. White arrows indicate regions where TOF-Voxels decreased after GAHT.
B) 3D projection of segmented vascular tree, with diameter values in participant 2. White arrows indicate regions where TOF-Voxels decreased after GAHT.
C) Percent change of TOF-Voxels. The decrease of TOF-Voxels is of the same magnitude as the decrease in CBF.
D) Change in arterial diameter in small arteries. Note that across all groups of small vessels there was a decrease in the number of voxels with in each diameter class.