-
Accelerated 3D-UTE-AFI B1 mapping to correct VFA-based T1 estimations in short T2* tissues
Marta Brigid Maggioni1, Martin Krämer1,2, and Jürgen R. Reichenbach1,2,3,4,5
1Medical Physics Group, Institute of Diagnostic and Interventional Radiology, Jena University Hospital - Friedrich Schiller University, Jena, Germany, 2Institute of Diagnostic and Interventional Radiology, Jena University Hospital - Friedrich Schiller University, Jena, Germany, 3Michael Stifel Center for Data-driven and Simulation Science Jena, Friedrich Schiller University, Jena, Germany, 4Abbe School of Photonics, Friedrich Schiller University, Jena, Germany, 5Center of Medical Optics and Photonics, Friedrich Schiller University, Jena, Germany
The proposed undersampled AFI method reduces the acquisition time of a AFI-based B1 map from 30 to 2 min in vivo, while still providing robust and consistent VFA-based AFI-corrected T1 estimations.

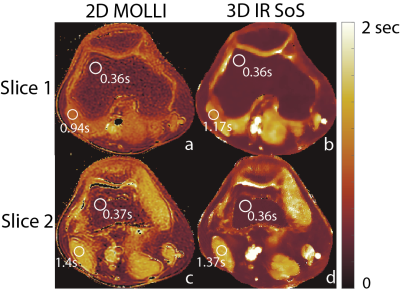
Figure 2: The top row presents T1 maps (in ms) of the knee of a volunteer after B1 correction with increasingly undersampled AFI-based B1 maps (bottom row).

Figure 1: T1 maps of the knee of a volunteer before and after the B1 correction with fully sampled AFI-based B1 maps. Notice the drop of the signal at the edge of the FoV that is corrected by the B1 map. The images are scaled between 0 and 1500 ms.
-
Feasibility of high resolution quantitative magnetic resonance imaging using variable flip angle and spoiling phase angle
Refaat E Gabr1, Lingzhi Hu2, Xingxian Shou2, Yongquan Ye2, Weiguo Zhang2, and Ponnada A Narayana1
1Diagnostic and Interventional Imaging, University of Texas Health Science Center at Houston, Houston, TX, United States, 2UIH America Inc., Houston, TX, United States
Feasibility
of high-resolution quantitative MRI was investigated using a novel variable
flip angle and RF spoiling phase angle approach. Quantification using single-
and two-compartment models was demonstrated in phantom and knee imaging
studies.

Figure 3: Parametric
tissue maps obtained with the proposed method.

Figure 1: Generated
T1 and T2 maps using the proposed approach and measured average values inside
the T1 and T2 spheres (points). The dashed line represents identity with
respect to the known phantom values.
-
CUTE: Compressed Sensing UTE for Multi-Echo T2* Mapping
Stefan Sommer1,2, Tom Hilbert3,4,5, Constantin von Deuster1,2, Natalie Hinterholzer2, Markus Klarhöfer1, and Daniel Nanz2,6
1Siemens Healthcare, Zurich, Switzerland, 2Swiss Center for Musculoskeletal Imaging (SCMI), Balgrist Campus, Zurich, Switzerland, 3Advanced Clinical Imaging Technology (ACIT), Siemens Healthcare, Lausanne, Switzerland, 4Department of Radiology, Lausanne University Hospital (CHUV), Lausanne, Switzerland, 5LTS5, École Polytechnique Fédérale de Lausanne, Lausanne, Switzerland, 6University of Zurich, Zurich, Switzerland
Mapping of short-T2* times is clinically feasible in under 3 minutes using a multi-echo UTE sequence in combination with
compressed sensing reconstruction.

Fitting results showing the initial signal strength
(proportional to the transverse magnetization, M0) and R2* maps for
the fully sampled (R=1), twice under-sampled (R=2) and four-fold under-sampled
(R=4) acquisitions in three orthogonal planes. Identical scaling was used for
all M0 [normalized signal intensity] and R2* [ms-1] maps.

Magnitude images and phase maps of a sagittal
slice. Fully sampled (R=1, top), two-fold (R=2), and four-fold (R=4) under-sampled (bottom)
datasets are shown for each of the 5 echoes (left to right), prior to R2*
fitting.
-
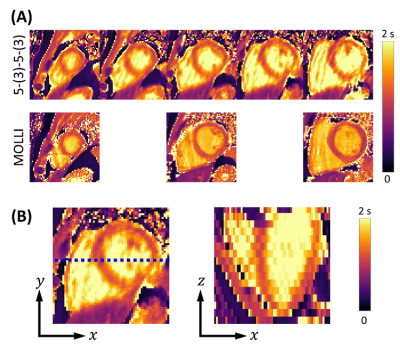
Super-resolution T2* mapping of the knee using UTE Spiral VIBE MRI
Céline Smekens1, Quinten Beirinckx2, Floris Vanhevel3, Pieter Van Dyck3, Arjan den Dekker2, Jan Sijbers2, Thomas Janssens1, and Ben Jeurissen2
1Siemens Healthcare NV/SA, Beersel, Belgium, 2imec-Vision Lab, Department of Physics, University of Antwerp, Wilrijk, Belgium, 3Department of Radiology, Antwerp University Hospital and University of Antwerp, Edegem, Belgium
Super-resolution T2* mapping based on UTE Spiral VIBE MRI allows for high-resolution T2* mapping of knee structures, showing comparable T2* maps to maps based on direct 3D UTE Spiral VIBE acquisitions while requiring approximately 25% less scan time.

Figure 3 – Representative T2* and PD maps estimated from 2 short (A and B) and 2 long (C and SR) acquisitions.

Figure 1 – Schematic representation of the super-resolution (SR) T2*-weighted acquisitions and model-based super-resolution reconstruction (SRR). 5 UTE Spiral VIBE datasets, consisting of 2 TEs each, were acquired with high in-plane and low through-plane resolution, while rotating around the frequency-encoding axis over angles of 0°, 36°, 72°, 108° and 144°. A model-based SRR framework, including a mono-exponential T2* relaxation model, was used to estimate high-resolution (HR) proton density (PD) and T2* maps directly from the series of low resolution T2*-weighted images.
-
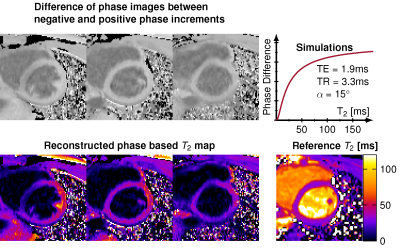
Fat-insensitive T2water measurement using multiple Dixon turbo spin-echo acquisitions with effective echo time increments
Ruaridh M Gollifer1,2, Tim JP Bray1,3, Margaret Hall-Craggs1,3, and Alan Bainbridge2
1Centre for Medical Imaging (CMI), University College London, London, United Kingdom, 2Department of Medical Physics and Bioengineering, University College London Hospital, London, United Kingdom, 3Department of Imaging, University College London Hospital, London, United Kingdom
The
proposed fat-insensitive T2water measurement, based on Dixon TSE
with effective TE increments, is accurate over a range of T2 and fat
fraction values and could provide a quantitative alternative to the widely-used
STIR sequence for imaging inflamed and/or oedematous bone and soft tissue.

Figure 4: Healthy volunteer scan of TSE Dixon sequence for water only images with
corresponding T2 map.
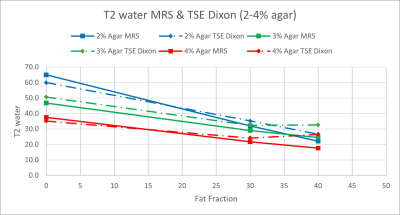
Figure 3: T2water values for TSE Dixon compared to
MRS for FFs of 0, 30 and 40% and agar concentrations of 2% (blue), 3% (green)
and 4% (red).
-
Prospective Accelerated Cartesian 3D-T1rho Mapping of Knee Joint using Data-Driven Optimized Sampling Patterns and Compressed Sensing
Marcelo Victor Wust Zibetti1, Azadeh Sharafi1, Mahesh Bharath Keerthivasan2, and Ravinder Regatte1
1Radiology, NYU Langone Health, New York, NY, United States, 2Siemens Healthineers, New York, NY, United States
A balanced
center-out k-space-filling scheme (or ordering) kept T1rho mapping values
stable across different acceleration factors in compressed sensing with
optimized SPs and Poisson disk SPs.

Figure 2: k-Space orderings used
for data collection. The a. linear
side-to-side (LSS) and b. linear
alternated center-out (LACO) are machine-provided orderings, used only in
fully-sampled acquisitions. The two customized orderings we evaluated are c. balanced center-out (BCO) and d. center-random (CR). For the same SP
and accelerated factor (AF), e. BCO
and g. CR differ only on how the
phase-encoding positions are ordered in each block. Both share the same initial
positions, but in f. BCO the
following points are closed to each other, while in h. CR the following points are random.

Figure 5: T1rho maps of a representative human
knee joint (medial slice on the top, lateral slice on the bottom) obtained with
different sampling patterns (SPs), such as optimal SP and Poisson disk (PD),
and both customized orderings: balanced center-out (BCO) and center-random (CR).
-
SuperMAP: Superfast MR Mapping with Joint Under-sampling using Deep Combined Network
Hongyu Li1, Mingrui Yang2, Jeehun Kim2, Chaoyi Zhang1, Ruiying Liu1, Peizhou Huang3, Sunil Kumar Gaire1, Dong Liang4, Xiaoliang Zhang3, Xiaojuan Li2, and Leslie Ying1,3
1Electrical Engineering, University at Buffalo, State University of New York, Buffalo, NY, United States, 2Program of Advanced Musculoskeletal Imaging (PAMI), Cleveland Clinic, Cleveland, OH, United States, 3Biomedical Engineering, University at Buffalo, State University of New York, Buffalo, NY, United States, 4Paul C. Lauterbur Research Center for Biomedical Imaging, Medical AI research center, SIAT, CAS, Shenzhen, China
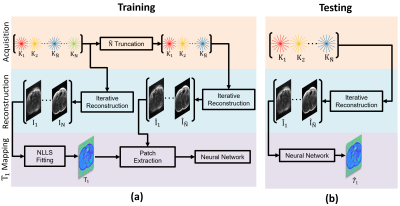
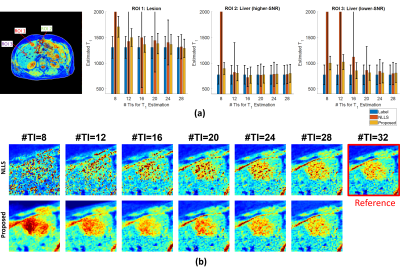
This
abstract presents a combined deep learning framework to generate MR parameter
maps from very few subsampled echo images.
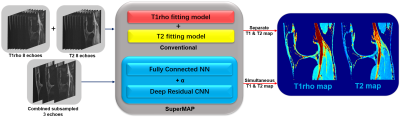
FIGURE 1. Schematic comparison of the
conventional model fitting and combined deep learning network SuperMAP with
joint spatial-temporal under-sampling.

FIGURE 2. T1rho maps from 3 echoes using combined
network SuperMAP and with single CNN network (RF 10.66), and the reference
T1rho maps from eight fully sampled echoes.
-
MR T1ρ preparations: B1 and B0 inhomogeneity response on 3T and 7T systems
Jeehun Kim1,2, Qi Peng3, Can Wu4,5, and Xiaojuan Li1,6
1Department of Biomedical Engineering, Program of Advanced Musculoskeletal Imaging (PAMI), Cleveland Clinic, Cleveland, OH, United States, 2Case Western Reserve University, Cleveland, OH, United States, 3Department of Radiology, Albert Einstein College of Medicine and Montefiore Medical Center, Bronx, NY, United States, 4Department of Medical Physics, Memorial Sloan Kettering Cancer Center, New York, NY, United States, 5Philips Healthcare, Andover, MA, United States, 6Department of Diagnostic Radiology, Cleveland Clinic, Cleveland, OH, United States
Six T1ρ preparation schemes were evaluated with ±250 Hz B0 inhomogeneity, and 1, 0.9, and
0.8 nominal B1 inhomogeneity in phantoms and volunteers at 3T and 7T. The
optimal prep scheme was identified regarding T1ρ quantification and image artifacts.

Figure 4 Volunteer
scan results from 7T. a) shows the nominal B1 map, and b) shows the B0
inhomogeneity map. As expected for 7T scanner, the B0 inhomogeneity was much
more severe compared to 3T. c) shows the NRMSE after fitting the echoes. Red
arrows indicate the area with large inhomogeneity. Similar to the previous results, Prep6 yields the best result.

Figure 1 Schematic of different T1ρ preparations.
For all preparations, 90 degree pulses had 400 us pulse duration,
and all non-spin-lock RF pulses (blue) had the same amplitude.
-
Efficient Phase Cycling Strategy for High Resolution Three-Dimensional GRE Quantitative Mapping
Qi Peng1, Can Wu2,3, Jee Hun Kim4,5, and Xiaojuan Li4,5,6
1Department of Radiology, Albert Einstein College of Medicine, Bronx, NY, United States, 2Department of Medical Physics, Memorial Sloan Kettering Cancer Center, New York, NY, United States, 3Philips Healthcare, Andover, MA, United States, 4Program of Advanced Musculoskeletal Imaging (PAMI), Cleveland Clinic, Cleveland, OH, United States, 5Department of Biomedical Engineering, Cleveland Clinic, Cleveland, OH, United States, 6Department of Diagnostic Radiology, Cleveland Clinic, Cleveland, OH, United States
Unpaired
phase cycling was shown to potentially suffer less from B0 inhomogeneities in a
quantitative T1rho mapping sequence on phantom and human studies with halved
scan time compared to the paired traditional approach.
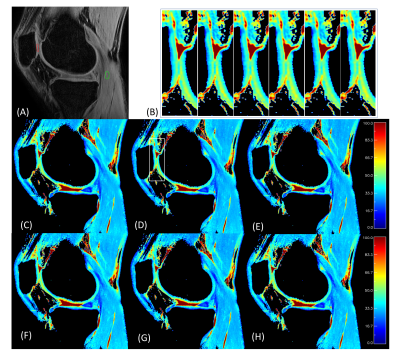
Figure 3.
Representative human T1ρ mapping results of different TSL sets. (A) TSL=0+.
Patellar (PAT) cartilage ROI is shown in red, and muscle (MUS) ROI is shown in
green; (C~H) Representative T1ρ maps obtained with TSL_sets 1~6, respectively. There is little difference between these maps.
To demonstrate the spatial fidelity of these methods, the zoom-in figures of a
small area (rectangle in (D)) are shown (B), each corresponding to TLS_set1 to
6 from left to right.

Figure 1. Representative phantom T1ρ mapping results. (A) Magnitude image of the center slice
of the phantom, with labeled tubes #1-6 and ROIs; (B-C) B0 and B1
maps of the slice at -3.6 cm with non-uniform B0 and B1
distributions; (D-I) T1ρ maps of the same slice using different TSL PC schemes of TSL_sets 1~6,
respectively. Their corresponding x- and y- line profiles from tube# 4 (as
shown in (D)) of the T1ρ map are shown in the bottom row. The y-profile is shifted by 2-pixels
for better visualization.
-
The feasibility of T1ρ magnetic resonance fingerprinting with a random design of T1ρ preparation at 11.7T
Qianfeng Wang1, He Wang1,2, Danyang Feng1, Fei Dai1, Yuwen Zhang1, and Baofeng Yang1
1Institute of Science and Technology for Brain-Inspired Intelligence, Fudan University, Shanghai, China, 2Human Phenome Institute, Fudan University, Shanghai, China, Shanghai, China
T1ρ-MRF method can greatly shorten the scan time, and is expected to have greater application value in T1ρ imaging.
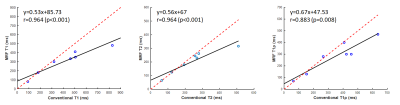
Figure 4, The mean T1, T2, and T1ρ relaxation times in phantoms for conventional and MRF methods. The dashed red line represents identity (y = x), while the black line is a linear fit of the data.

Figure 3, Phantom T1, T2, and T1ρ relaxation maps for conventional methods and the proposed T1ρ-MRF sequence.
-
In vivo $$$T_1$$$ quantification at 0.1 T using a fast, interleaved Look-Locker based $$$T_1$$$ mapping sequence.
Marco Fiorito1, Maksym Yushchenko1, Davide Cicolari2, Mathieu Sarracanie1, and Najat Salameh1
1Center for Adapatable MRI Technology (AMT center), Department of Biomedical Engineering, University of Basel, Allschwil, Switzerland, 2Department of Physics, University of Pavia, Pavia, Italy
Diagnosis
and treatment monitoring can benefit from local $$$T_1$$$ information. Here, a fast
Look-Locker based $$$T_1$$$ mapping sequence is used to produce an in vivo map
of a volunteer’s hand at 0.1 T.

In vivo $$$T_1$$$ map of a
volunteer’s hand. The main structures visible in the reference anatomical
image (2D GRE) are retrieved in the $$$T_1$$$ map. In this case, a shorter TI (25 ms)
was chosen to better characterise the structures with a short $$$T_1$$$ .

Schematic representation of
the Look-Locker-based $$$T_1$$$ mapping sequence. The interleaved scheme allows to
change the number of slices without impacting the scan time. Nonetheless, more
slices signify longer TIs, which can impact the retrieval of short relaxation
times. The use of a saturation pulse was
chosen to avoid waiting for full $$$T_1$$$ recovery, hence reducing the acquisition
time.
-
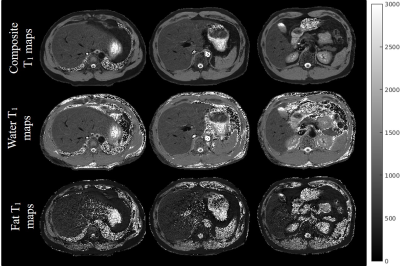
Simultaneous Fat- and B1-Corrected T1 Mapping Using Chemical-Shift Encoded MRI
Nathan Tibbitts Roberts1,2, Diego Hernando1,3, Daiki Tamada1, and Scott B Reeder1,3,4,5,6
1Radiology, University of Wisconsin - Madison, Madison, WI, United States, 2Electrical and Computer Engineering, University of Wisconsin - Madison, Madison, WI, United States, 3Medical Physics, University of Wisconsin - Madison, Madison, WI, United States, 4Biomedical Engineering, University of Wisconsin - Madison, Madison, WI, United States, 5Medicine, University of Wisconsin - Madison, Madison, WI, United States, 6Emergency Medicine, University of Wisconsin - Madison, Madison, WI, United States
Fat and B1 are known confounders of quantitative T1 mapping. In this work we propose a hybrid variable flip angle, B1 mapping, and chemical shift encoded MRI acquisition to estimate T1, fat-fraction, and R2* while simultaneously estimating and correcting for both B0 and B1 inhomogeneities.
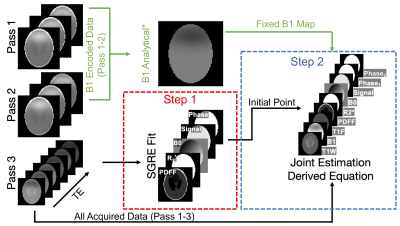
Figure 2. Fat- and B1- corrected T1W is estimated using a two-step fitting. In the first step, data from pass 3 are used in a non-T1 weighted multi-echo SGRE fitting to determine an initial point for the joint estimation. In the second step, the derived signal model is used in a non-linear least squares fitting of all data to estimate parameters, including T1W, T1F, signal amplitude, signal phases (shared pass 1&2 / independent pass3), R2*, PDFF, B1 and B0. *For acquisitions without fat, B1 can be calculated analytically10 and fixed in the following joint estimation (shown in green).

Figure 5. T1W estimates in gel agar phantom experiments (A) showed good agreement with the phantom design values (B) and decent agreement with STEAM-MRS measurements (C). Global B1 errors were introduced by manipulating the transmit gain (TG) at scan time. Plots (B,C) show that T1W estimation bias is greatly reduced by the proposed simultaneous B1 estimation, but not entirely removed.
-
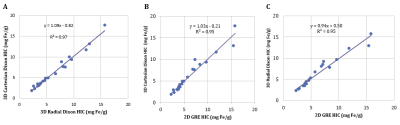
Inter-vendor 3T R2* mapping evaluation on a standardized R2* phantom with and without a human subject
Justin Yu1, Anshuman Panda1, and Alvin Silva1
1Department of Radiology, Mayo Clinic Arizona, Phoenix, AZ, United States
Standard sequences for quantitative R2* mapping do not precisely
measure large R2* values in a phantom. This can lead to errors in LIC quantification
for patients with iron overload. Patient specific QA may be necessary for
clinical R2* mapping.
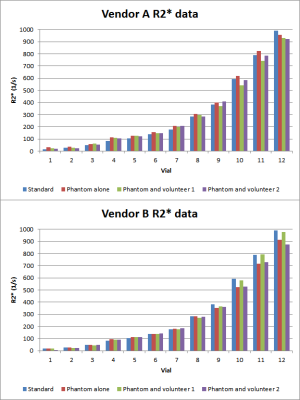
Summary
of measured R2* values for both volunteers for vendor A and vendor B.

Top:
phantom setup with body coil. Middle: sample ROI measuring R2* in one of the
phantom’s vials. Bottom: T2 weighted image illustrating positioning of phantom
with volunteer.
-
Effects of fibre dispersion and myelin content on R2*: simulations and post-mortem experiments
Francisco Javier Fritz1, Mohammad Ashtarayeh1, Joao Periquito2, Andreas Pohlmann2, Markus Morawski3, Carsten Jaeger4, Thoralf Niendorf2, Kerrin J. Pine4, Evgeniya Kirilina4,5, Nikolaus Weiskopf4,6, and Siawoosh Mohammadi1
1Institut für Systemische Neurowissenschaften, Universitätklinikum Hamburg-Eppendorf, Hamburg, Germany, 2Berlin Ultrahigh Field Facility (B.U.F.F.), Max-Delbrueck-Center for Molecular Medicine in the Helmholtz Association, Berlin, Germany, 3Paul Flechsig Institute of Brain Research, University of Leipzig, Leipzig, Germany, 4Department of Neurophysics, Max Planck Institute for Human Cognitive and Brain Sciences, Leipzig, Germany, 5Center for Cognitive Neuroscience Berlin, Free University Berlin, Berlin, Germany, 65Felix Bloch Institute for Solid State Physics, Faculty of Physics and Earth Sciences, Leipzig University, Leipzig, Germany
R2*-angular dependency is modulated by fibre dispersion and the angular dependency is removed using high-order models. However, ex vivo experimental data results at small angular orientation and dispersion was only reflected in simulations when accounting for myelin-water contributions.

Figure 2: Experimental dataset: (A) GRE
MRI of the OC in all anatomical planes. Here the optic tracts (OT) and optical
nerves (ON) are indicated, together with the B0 direction (yellow
arrow). (B) The MR transversal images of the first three angular measurements
before (top row) and after coregistration (bottom row) (left). Using the
transformation matrix, the direction of B0 per angular measurement
were calculated (right).

Figure 5: Orientation dependence of the
parameters in M2 (β0M2 in the top row, β1M2
in the middle row and β2M2 in the bottom row) for the
simulated data without (A) and with myelin water (B) contribution, and
experimental (C) dataset. It is observed that the angular dependency is removed for β0M2
and β1M2 and transferred to β2M2 for
all dataset and fibre’s dispersions. Importantly,
the negative β2M2 values at small angles observed in the
experimental dataset are only replicated if the myelin pool is added to the
simulations.
-
The impact of multi-compartment microstructure on single-compartment T1 estimates
Giorgia Milotta1, Nadège Corbin1,2, Antoine Lutti3, Siawoosh Mohammadi4,5, and Martina Callaghan1
1Wellcome Centre for Human Neuroimaging, UCL Queen Square Institute of Neurology, University College London, London, United Kingdom, 2Centre de Résonance Magnétique des Systèmes Biologiques, UMR5536, CNRS/University Bordeaux, Bordeaux, France, 3Laboratory for Research in Neuroimaging, Department for Clinical Neuroscience, Lausanne University Hospital and University of Lausanne, Lausanne, Switzerland, 4Department of Systems Neurosciences, University Medical Center Hamburg-Eppendorf, Hamburg, Germany, 5Department of Neurophysics, Max Planck Institute for Human Cognitive and Brain Sciences, Leipzig, Germany
R2*
and T1 estimates depended not only on myelin-water fraction and
residency time, but also on the transmit field efficiency and the specifics of
the estimation. The assumption of a single compartment impacts both measures
leading to observable variance in simulation and in vivo.

Figure 2
– R2*(A) and T1 (B) estimates as function of residency
time (range 100-500ms) and fMW (range 2-20%) with fixed B1eff=100%.
R2* increases as fMW increases due to higher contribution
of the myelin-water compartment (short T2*) in the two-compartment
model. Similarly, a decrease in T1 is observed with increasing fMW
due to higher contribution of the myelin compartment (short T1). C)
Quantification of R2* and T1 variations as a function of
residency time and myelin water fraction.

Figure 3
– A) T1 dependence on B1eff for different residency times
(columns) and the three analysed strategies (rows). ESTATICS shows greater T1
variation for low residency time =100ms, whereas per contrast shows high T1
variation for long residency time = 500ms. B) T1 variation as
function of B1eff for different residency times.
-
Towards in-vivo myeloarchitecture: optimising T1 maps point spread function by very high resolution multi-shot inversion-recovery EPI
Fabrizio Fasano1,2, John Evans3, Chloe Benson4, Yifei Wang4, Derek K Jones3,5, Alison Paul4, and Robert Turner6,7
1Siemens Healthcare Ltd, Camberly, United Kingdom, 2Siemens Healthcare GmbH, Erlangen, Germany, 3Cardiff University Brain Research Imaging Centre (CUBRIC), Cardiff University, Cardiff, United Kingdom, 4School of Chemistry, Cardiff University, Cardiff, United Kingdom, 5Mary McKillop Institute for Health Research, Faculty of Health Sciences, Australian Catholic University, Melbourne, Australia, 6Department of Neurophysics, Max Planck Institute for Human Cognitive and Brain Sciences, Leipzig, Germany, 7Sir Peter Mansfield Imaging Centre, University of Nottingham, Nottingham, United Kingdom
The multi-shot inversion recovery slice shuffled EPI approach, recently proposed by Sanchez and co-workers to map myelin patterns, shows good reproducibility and good quality point spread function, appearing suitable to detect myelination processes at a nominal 400μm in-plane resolution.
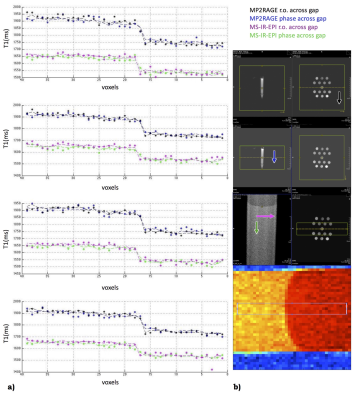
Fig.3. Signal profiles of 4 lines across the gel boundary. Dashed lines represent the average values across the lines. Voxels size is 400µm; b) From top: legend, positioning for MP2RAGE and MS-IR-EPI, the 4 lines sampling. Arrows indicate phase (phase 2 for MP2RAGE) direction. Both MPRAGE and MS-IR-EPI show a good profile, mostly affected by the true object shape/partial volume/k-space sampling effect. The difference in T1 estimation is expected, being MP2RAGE protocol suboptimal to assess a 1500ms T1 (our focus is on PSF here).

Fig.4. OTF, PSF and signal intensity profile estimated for an image profile with a gel boundary thickness similar to that of phantom #14. T1=1500ms. The true profile is superimposed. For sake of simplicity, full-Fourier versions were simulated. The estimated MS-IR-EPI and TI=2250 MP2RAGE profiles are close to the true profile. The estimated PSF and signal profile of MP2RAGE for TI=800ms show significant broadening, incompatible with imaging typical cortical myelinated layers
-
Pseudo-T2 mapping of T2-weighted MRI of the prostate: Comparison to gold standard
Kaia Ingerdatter Sørland1, Pål Erik Goa2,3, Kirsten Margrete Selnæs1,3, Elise Sandsmark3, Cristopher George Trimble1, Mohammed R. S. Sunoqrot1, Mattijs Elschot1,3, and Tone F. Bathen1,3
1Department of Circulation and Medical Imaging, Norwegian University of Science and Technology, Trondheim, Norway, 2Department of Physics, Norwegian University of Science and Technology, Trondheim, Norway, 3Department of Radiology and Nuclear Medicine, St. Olavs University Hospital, Trondheim, Norway
Pseudo-T2 values achieved with Autoref normalization of prostate T2-weighted images are comparable to the gold standard prostate T2 values obtained with T2 mapping. The T2 value contrast between the prostate zones can also be conserved with Autoref normalization.

Table 1: The prostate T2 values from the multi-echo spin echo (MESE) imaging sequence and the prostate pseudo-T2 values from Autoref with different reference tissues, averaged over seven healthy volunteers.
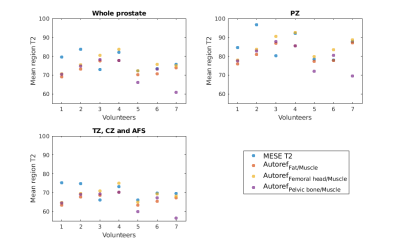
Figure 2: The spread in mean prostate T2 and pseudo-T2 for all seven volunteers, both from MESE and Autoref with three pairs of reference tissues.
-
Reliability and reproducibility of synthetic spine MRI with different coils
Yitong Li1, Xiaoqing Liang1, Bowen Hou1, Yan Xiong1, Weiyin Vivian Liu2, and Xiaoming Li1
1Tongji Hospital, Tongji Medical College, Huazhong University of Science and Technology, Wuhan, China, 2MR Research, GE Healthcare, Beijing, China
Coils may influence quantitative measurements of
synthetic lumbar spine MRI; therefore, usage of the same coil should be adopted
when one study is carried out.

Figure 2: Box
plots for T1, T2, and PD values of different
tissues compared between different coils. VIS means
considering the vertebral bodies and intervertebral discs together. * indicates
p <0.05; ** indicates p <0.01; *** indicates p <0.001.

Figure
1: Quantitative maps of a 26-year-old female volunteer. (A-C) T1 map; (D-F) T2
map; (G-I) PD map. Maps from left to right were obtained using Spine DST, Body,
and Flex Large, respectively.
-
T1rho Dispersion Imaging of Intervertebral Discs
Ping Wang1, Jay D Turner1, Juan Uribe1, and John C Gore2
1Barrow Neurological Institute, Phoenix, AZ, United States, 2Institute of Imaging Science, Vanderbilt University, Nashville, TN, United States
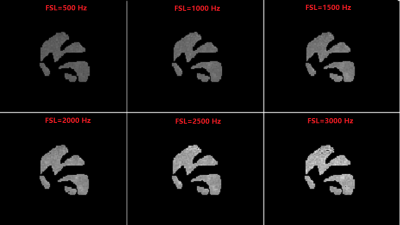
A T1ρ dispersion imaging method has been successfully developed for human lumbar spine. This technique has potential for detecting proteoglycan loss in the early degenerative disc disease.

Fig. 3: T1ρ maps acquired under FSL = 100Hz (A) and 300Hz (B), with TSLs = [1ms, 11ms, 21ms, 31ms, 41ms]. The T1ρ dispersion, i.e., T1ρ = T1ρ(300Hz) - T1ρ(100Hz), is displayed in (C).
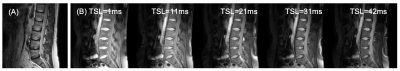
Fig. 2: T1ρ imaging on a 43-yrs female healthy volunteer. (A) T2-weighted image for structural information. (B) T1ρ-weighted images at spin-lock times (TSLs) = [1ms, 11ms, 21ms, 31ms, 41ms] under a spin-lock frequency (FSL) of 300Hz.
-
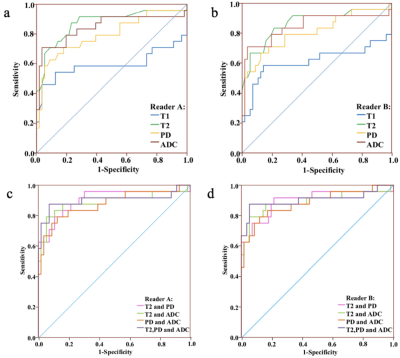
Distinction of T2 quantitative measurements between the nucleus pulposus and anulus fibrosus using Gaussian-fitted histogram analysis
Xiaoqing Liang1, Weiyin Vivian Liu2, Jingyi Wang1, and Xiaoming Li1
1Tongji Hospital, Tongji Medical College, Huazhong University of Science and Technology, Wuhan, China, 2MR Research,GE Healthcare, Beijing, China
Gaussian-fitted
histogram analysis of T2 relaxation time could achieve quantitative measurement
of the distinction between the
nucleus pulposusand anulus fibrosus, and Gaussian-fitted histogram
parameters have good performance in diagnosing and staging disc degeneration.
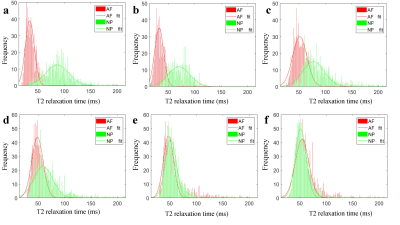
Figure.1 T2
histograms and Gaussian distributions of AF and NP.
a-e: Pfirrmann grade I-Ⅴ discs. The peak value of the NP gradually decreased
and shifted towards the peak of the AF with the increasing grades.
f: The peak value of the
NP was significantly lower than
the AF of grade Ⅳ
disc.

Figure.3 Receiver operating characteristic (ROC)
curves analysis of all
quantitative parameters
for distinguishing healthy discs from degeneration ones.