-
Quantitative Susceptibility Mapping (QSM) is Sensitive to Hippocampal and Subcortical Gray Matter Changes in Temporal Lobe Epilepsy
Oliver C. Kiersnowski1, Gavin P. Winston2,3, Emma Biondetti1,4, Sarah Buck2, Lorenzo Caciagli2,5, John Duncan2, Karin Shmueli1, and Sjoerd B. Vos6,7
1Department of Medical Physics and Biomedical Engineering, University College London, London, United Kingdom, 2Department for Clinical and Experimental Epilepsy, University College London, London, United Kingdom, 3Department of Medicine, Division of Neurology, Queen's University, Kingston, ON, Canada, 4Institut du Cerveau – ICM, INSERM U 1127, CNRS UMR 7225, Sorbonne Université, Paris, France, 5Department of Bioengineering, University of Pennsylvania, Philadelphia, PA, United States, 6Centre for Medical Image Computing, Computer Science Department, University College London, London, United Kingdom, 7Neuroradiological Academic Unit, UCL Queen Square Institute of Neurology, University College London, London, United Kingdom
Magnetic susceptibility values
differ significantly between 23 healthy controls and 31 people with temporal
lobe epilepsy (TLE) in the thalamus, putamen, and globus pallidus. Hippocampal
susceptibility values are asymmetric in TLE patients, with lower values in the affected
hippocampus.

Figure 1:
Example T1-weighted image (left) with ROIs superimposed (caudate: R=yellow,
L=dark blue; putamen: R=red; L=dark green; globus pallidus: R=pink, L=light
blue; thalamus: R=light green, L=brown), first and final echo gradient echo
(GE) magnitude image, and susceptibility map calculated using iterative
Tikhonov regularisation and weak harmonic (WH) QSM for a representative control
subject. WH QSM was used here as its reduced noise and residual background
fields yielded significant $$$\chi$$$ differences unlike
the iterative Tikhonov technique.

Figure 2: Box plots of deep gray matter regions with significant group differences in age-corrected mean susceptibility. HC=healthy controls, LTLE=left temporal lobe epilepsy, RTLE=right temporal lobe epilepsy. * indicates p<0.05, ** indicates p<0.01, *** indicates p<0.001.
-
Increased connectivity strength in operculo-insular epilepsy leveraged by COMMIT-based surface-enhanced tractography
Sami Obaid1,2, Françcois Rheault2,3, Manon Edde2, Guido Guberman4, Etienne St-Onge2, Jasmeen Sidhu2, Alain Bouthillier5, Alessandro Daducci6, Dang Khoa Nguyen7, and Maxime Descoteaux2
1Department of Neurosciences, Université de Montréal, Montréal, Quebec, Canada, Montréal, QC, Canada, 2Sherbrooke Connectivity Imaging Lab (SCIL), Université de Sherbrooke, Sherbrooke, Quebec, Canada, Sherbrooke, QC, Canada, 3Electrical Engineering, Vanderbilt University, Nashville, TN, United States, Nashville, TN, United States, 4Department of Neurology and Neurosurgery, Faculty of Medicine, McGill University, Montreal, QC, Canada, Montreal, QC, Canada, 5Division of Neurosurgery, CHUM, Montréal, Quebec, Canada, Montreal, QC, Canada, 6Department of Computer Science, University of Verona, Verona, Italy, Verona, Italy, 7Service de Neurologie, CHUM, Montréal, Québec, Canada, Montreal, QC, Canada
Using a cutting-edge quantitative connectivity
pipeline incorporating surface-enhanced tractography and ‘connectivity
strength’-defining COMMIT weights, we observed a specific pattern of increased
‘connectivity strength’ in the epileptic network of operculo-insular epilepsy.

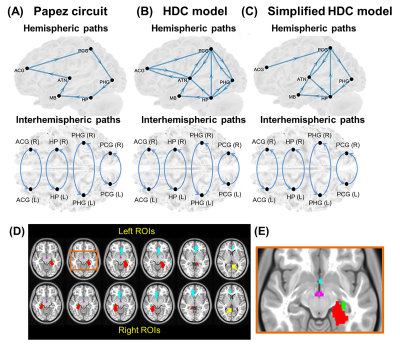
Figure 2. Illustration of a group comparison of
whole-brain COMMIT weights between of HCs and OIE. Multiple connections showed
significant alterations both ipsilaterally and contralaterally. Group comparisons
were performed using one-tailed t-tests. Significance was thresholded at p<0.001
uncorrected. Age and gender were accounted for in HCs whereas age,
gender, side of epileptic focus, duration of epilepsy and age of onset of
epilepsy were accounted for in OIE patients. Matrices in both HCs and OIE
patients were masked based on a similarity threshold calculated in HCs.
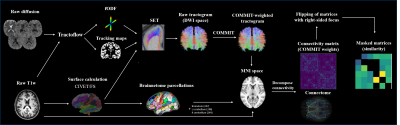
Figure
1. Flowchart. Raw images were processed using Tractoflow. The output of
Tractoflow and CIVET-calculated surfaces were used to build the tractogram
using SET. COMMIT filtering was then performed. In parallel, the Freesurfer-calculated
surfaces were used to generate Brainnetome parcels. The COMMIT-weighted
tractogram and Brainnetome parcellations were used to derive structural
connectivity matrices. Matrices of patients with right-sided OIE or TLE were
then side-flipped and bundles that were anatomically dissimilar between
controls were excluded in all matrices.
-
Association of hypometabolic extension of 18F-FDG PET with DTI in hippocampal sclerosis
Hiroyuki Tatekawa1, Hiroyuki Uetani1, Akifumi Hagiwara1, and Noriko Salamon1
1UCLA, Los Angeles, CA, United States
Associations between hypometabolism and DTI alterations, with more widespread GM abnormalities for broad hypometabolic HS than localized HS and significantly decreased FA in the temporal and frontal WM for broad hypometabolic HS, were observed.

Summary

Overview of post-processing of MRI and FDG PET.
-
Analysis of Exchangeable Pool Contributions to the Chemical Exchange Saturation Transfer Signal Using a 2-stage Simulation Method
Qingqing Wen1, Kang Wang2, Yi-Cheng Hsu3, Yan Xu4, Yi Sun3, Dan Wu1,2, and Yi Zhang1,2
1Key Laboratory for Biomedical Engineering of Ministry of Education, Department of Biomedical Engineering, College of Biomedical Engineering & Instrument Science, Zhejiang University, Hangzhou, China, 2Department of Neurology, First Affiliated Hospital, College of Medicine, Zhejiang University, Hangzhou, China, 3MR Collaboration, Siemens Healthcare Ltd., Shanghai, China, 4Department of Neurosurgery, Zhejiang Provincial People's Hospital, HangZhou, China
A 2-stage simulation
method was proposed to assess the metabolite contribution to the CEST contrast
between disease and normal tissues, which may provide a route for investigating
the change of molecular content in pathologies compared with normal tissues.
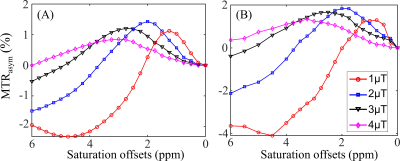
Figure 2. Simulated (A) and
experimental (B) MTRasym curves in the normal brain tissues for B1
values of 1, 2, 3, and 4μT. The experimental curves (B) represented the mean MTRasym
spectra of the normal brain tissues in 9 TSC patients.

Figure 3. Comparison of
experimental (A) and simulated (B-F) MTRasym spectra with the
proposed 2-stage method at four B1 levels. The MTRasym curves in normal
tissues (red lines) were simulated with the parameters listed in Table 1. As
for the MTRasym spectra in cortical tubers (black lines), they were
obtained via varying T1 (part B), T2 (part C), MMT
(part D), Mamide (part E), and Mamine (part F) according
to Table 2B, in order to generate the mRMSE between simulated and experimental
CEST contrast for each of the candidate Bloch-McConnell parameters.
-
Evaluating Brain Iron Content in Patients with Idiopathic Rapid Eye Movement Sleep Behavior Disorder
Kiarash Ghassaban1,2, Chao Chai3, Huiying Wang4, Tong Zhang3, Jinxia Zhu5, Xianchang Zhang5, E. Mark Haacke1,2, and Shuang Xia3
1Department of Radiology, Wayne State University, Detroit, MI, United States, 2SpinTech, Inc., Bingham Farms, MI, United States, 3Department of Radiology, Tianjin First Central Hospital, Tianjin, China, 4Department of Neurology, Tianjin Medical University General Hospital Airport Site, Tianjin, China, 5MR Collaboration, Siemens Healthcare Ltd, Beijing, China
The iRBD patients
had a higher incidence of Nigrosome-1 loss and increased iron in the right
dentate nucleus. Cognitive and motor impairment scores were associated with
iron in some of the deep gray matter structures.

Figure
1. Regions of interest traced on quantitative
susceptibility maps on three representative slices showing deep gray matter
nuclei in A) the basal ganglia; blue: caudate nucleus, orange: putamen, cyan:
globus pallidus, green: thalamus, red: pulvinar thalamus. B) midbrain; purple:
red nucleus, yellow: substantia nigra. C) cerebellum; orange: dentate nucleus.

Figure 2. Nigrosome-1 sign in the substantia nigra. The top
row shows bilateral presence of N1 in A) tSWI, B) QSM, C) SWI and D) T2*W of a
healthy control. E, F) tSWI and QSM images of an iRBD patient with unilateral
loss of N1 in the left hemisphere. G, H) tSWI and QSM images of an iRBD patient
with bilateral loss of N1.
-
Early Diagnosis of Dementia (AD/MCI/Normal Aging) Based on CBF-Maps Derived from ASL–MRI and Artificial Intelligence
Soroor Kalantari1, Fardin Samadi Khosh Mehr2, Mohammad Soltani1, Mehdi Maghbooli3, Zahra Rezaei4, Soheila Borji1, Behzad Memari1, Mohammad Bayat1, Behnaz Eslami5, and Hamidreza Saligheh Rad6
1Department of Radiology, Zanjan University of Medical Science, Zanjan, Iran (Islamic Republic of), 2Department of Medical Physics and Biomedical Engineering, Tehran University of Medical Sciences, Tehran, Iran (Islamic Republic of), 3Department of Neurology, Zanjan University of Medical Science, Zanjan, Iran (Islamic Republic of), 4Department of Computer and Electrical Engineering, University of Kashan, Kashan, Iran (Islamic Republic of), 5Tehran Islamic Azad University, Tehran, Iran (Islamic Republic of), 6Quantitative MR Imaging and Spectroscopy Group, Research Center for Molecular and Cellular Imaging, Department of Medical Physics and Biomedical Engineering, Tehran university of Medical Science, Tehran, Iran (Islamic Republic of)
Automated classification methods showed excellent performance to
distinguish AD versus normal cognitive group (ACC: 100%, AUC: 0.88), AD versus
MCI (acuracy:%88, AUC: 0.90) and MCI versus normal cognitive group (ACC: 95%,
AUC: 1)

Figure 2.
Absolute perfusion image using voxel-wise calibration (left) and after
correction volume effects around the edge of the brain (right)

Figure 3. CBF map extracted from the kinetic
model (left). The image of estimated PVs of gray matter (center), and the
estimated gray matter perfusion (right)
-
On the Spectrum of Dysmaturation of the Extremely Preterm Brain at Adolescence: Combined MS-qMRI Outcomes of the ELGAN-ECHO Study.
Ryan McNaughton1, Hernan Jara1,2, Chris Pieper2, Julie Rollins3, Osamu Sakai2, Laurie Douglass2, Rebecca Fry3, Karl Kuban2, and T. Michael O'Shea3
1Boston University, Boston, MA, United States, 2Boston University Medical Center, Boston, MA, United States, 3University of North Carolina at Chapel Hill School of Medicine, Chapel Hill, NC, United States
MS-qMRI of the EP brain at
adolescence comprehensively quantifies the dysmaturation states, from white
matter structure to CSF composition. Maps of T1, T2, PD, and spatial entropy generated
for 341 EP born individuals, exhibited linear relationships of T1 and PD with
SE, and T2 with CSF volume.

Example
MS-qMRI maps of (A) T1, (B) T2, (C) PD, and (D) Spatial Entropy for a
15-year-old female.

Scatterplots
of the mean T1 versus spatial entropy of the white matter within the
intracranial matter. The solid lines represent linear regression of females
(circle) and males (triangle). Distribution plots of the variables are provided
to highlight gender related differences.
-
Brain Function in Obesity: A Pilot Study to Assess Effects of Bariatric Surgery
Nareen Anwar1, Wesley J Tucker2, Nancy Puzziferri3, Jake Samuel2, Vlad G Zaha3, Ildiko Lingvay3, Jaime Almandoz3, Jing Wang2, Edward A Gonzales2, Matthew Brothers2, Michael Douglas Nelson2, and Binu P Thomas2,3
1The University of Texas at Dallas, Richardson, TX, United States, 2The University of Texas at Arlington, Arlington, TX, United States, 3University of Texas Southwestern Medical Center, Dallas, TX, United States
The mechanisms that drive improvements in neurocognitive function after bariatric surgery are unknown. In this study, magnetic resonance imaging is utilized to
assess changes in cerebral metabolic rate of oxygen (CMRO2) levels in bariatric
surgery candidates before and after their surgery.

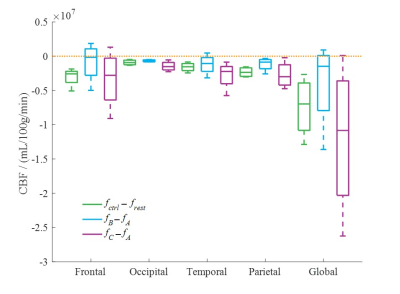
A comparison of (a) BMI and (b) cognitive function within bariatric
surgery candidates before (Bar-pre), 2 weeks after (Bar-post 2wk), and 14 weeks
after surgery (Bar-post 14wk). Compared to pre-surgery BMI, Bariatric surgery
candidates have a significantly reduced BMI 2 weeks after surgery (p = 0.001)
and 14 weeks after surgery (p = 0.0001). Cognitive function increases and is
significantly greater 2 weeks post-surgery (p = 0.026) and 14 weeks
post-surgery (p = 0.003) when compared to pre-surgery.

A comparison of CMRO2 among bariatric surgery candidates
before, 2 weeks after (Bar-post 2wk), and 14 weeks after surgery (Bar-post
14wk), young healthy controls (YHC) and age matched healthy controls (AM HC).
Before bariatric surgery, patients have a significantly higher CMRO2
than AM HC (p = 0.02), as well as 2 weeks post-surgery (p = 0.003).
-
An n=1 approach to white matter anomaly detection in epilepsy
Maxime Chamberland1, Dmitri Shastin1,2, Sila Genc1, Khalid Hamandi1,3, William P. Gray1,2, Chantal M.W Tax1, and Derek K. Jones1
1Cardiff University Brain Research Imaging Centre (CUBRIC), Cardiff University, Cardiff, United Kingdom, 2Department of Neurosurgery, University Hospital Wales, Cardiff, United Kingdom, 3Department of Neurology, University Hospital of Wales, Cardiff, United Kingdom
We present a microstructure-informed anomaly detection framework to shift from traditional group-based comparisons to true personalised-radiology in epilepsy. Using a normative modelling approach, deep white matter anomalies were identified in patients with focal cortical dysplasia.
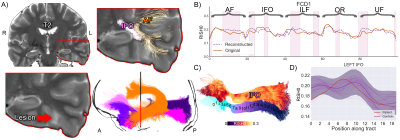
S1 overview. A) T2 hyperintense lesion
located at the base of the skull in the temporal lobe. Several pathways with
anomalies interdigitate in the vicinity of the lesion. The shaded area (bottom
right) shows the mean population profile (bold purple line, shaded area = +/-1
z-score). Although the IFO signal did not extend beyond the shaded area (C, D),
the proposed anomaly detection framework identified abnormalities in that
region (B, pink areas). Bold orange line: original tract-profiles. Dotted
purple line: reconstructed representation learned from the network.

S2 overview. A) The lesion is located anterior
to the right primary motor cortex in the supplementary motor area (hyperintense signal on the FLAIR image, hypointense on the RISH map). Tractography show tracts traversing the area (CC4). B) Anomalies
were identified in the right CC4, CST, and SLF-I bundles (top right, pink areas).
The bold orange line represents the original tract-profiles whereas the dotted
purple line represents the reconstructed representation learned from the
network. The z-score approach shows less focused anomaly patterns along
the tracts (shaded area: +/- 1 Z).
-
Graph-based global reasoning of DWI tractography connectome allows reproducible prediction of language impairment in pediatric epilepsy
Jeong-Won Jeong1, Soumyanil Banerjee2, Min-Hee Lee1, Nolan O'Hara3, Csaba Juhasz1, Eishi Asano1, and Ming Dong2
1Pediatrics, Wayne State University, Detroit, MI, United States, 2Computer Science, Wayne State University, Detroit, MI, United States, 3Translational Neuroscience Program, Wayne State University, Detroit, MI, United States
Global reasoning and aggregation of DWI connectome
features improved the prediction of language impairment in children with focal
epilepsy without relying on a specific DWI connectome node configuration when compared
to other deep learning methods.

Figure 3. Examples of activation maps highlighting the important Ωi for
prediction of expressive and receptive language score. Each 3D visualization
shows the nodes of Ωi and their contributions (i.e., Z scores of attenuation
weights) to increase the prediction accuracy, quantified by the thickness of an
individual tube. Thicker tubes indicate that a node is more predictive of observed
language scores. Relatively small attention weights (i.e., Z-scores less than
2.5 standard deviations of each map) were omitted for clarity.

Figure 1. The architecture diagram of the proposed CNN+GCN model, which takes the connectome
matrix S as input, to predict an output score t. Here, “**” indicates 2D
convolution, and “*” indicates 1D convolution. In the final layer, a linear
unit is used for language score regression.
-
Two patterns of cortical thickness relate to seizure relapse in pediatric patients with epilepsy after treatment
Wenjing Zhang1, Tao Yu2, Mengyuan Xu1, Chengmin Yang1, Naici Liu1, Su Lui1, and Haibo Qu3
1Huaxi MR Research Center (HMRRC), Department of Radiology, West China Hospital of Sichuan University, Chengdu, China, 2Department of Pediatrics, West China Second University Hospital, Sichuan University, Chengdu, China, 3Department of Radiology, Key Laboratory of Obstetric & Gynecologic and Pediatric Diseases and Birth Defects of Ministry of Education, National Key Laboratory of Biotherapy, West China Second University Hospital, Sichuan University, Chengdu, China
Using biological imaging measures and data-driven
method, we observed two different patterns of cortical morphometric features of
gray matter in the early stage of pediatric patients with epilepsy, which were associated with the seizure relapse after treatment.

Cluster dendrogram and heat
map using cortical thickness measures in pediatric patients with epilepsy.

Regional cortical thickness
differences between patient subgroups and healthy controls.
-
Cerebral Morphometric Alterations in Patients with Temporal Lobe Epilepsy related to Antero-inferior Temporal Meningoencephalocele
Laleh Eskandarian1,2, Safak Parlak3, Gokce Ayhan4, Irsel Tezer4, Serap Saygi4, and Kader Karli Oguz2,3
1Neuroscience Department, Bilkent University, Ankara, Turkey, 2National Magnetic Resonance Research Center (UMRAM), Bilkent University, Ankara, Turkey, 3Faculty of Medicine, Department of Radiology, Hacettepe University, Ankara, Turkey, 4Faculty of Medicine, Department of Neurology, Hacettepe University, Ankara, Turkey
This study investigates morphological alterations in patients with left TLE. Compared with HCs, cortical thickness was increased extensively in both cerebral hemispheres, both amygdala were significantly bigger and no difference was found in hippocampi and thalami.

Figure 2. Cortical thickness in patients vs HC shown on the inflated surface of the brain. Red and blue show regions with significantly thicker cortex in the patients and HCs respectively.
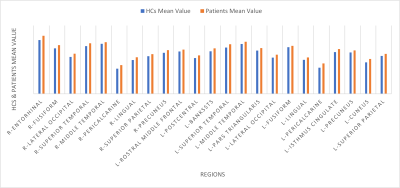
Figure 1. Cortical areas with statistically significant increased thickness in patients compared with HCs
-
Lateralization of Temporal Lobe Epilepsy Using Multimodal MRI, Decision Tree, and Random Forest Methods
Alireza Fallahi1, Neda Mohammadi-Mobarakeh2, Narges Hosseini Tabatabaei3, Mohammad Pooyan4, Jafar Mehvari-Habibabadi5, Mohammad-Reza Ay2, and Mohammad-Reza Nazem-Zadeh2
1Shahed University, Tehran, Iran (Islamic Republic of), 2Tehran University of Medical Sciences, Tehran, Iran (Islamic Republic of), 3Brain and Spinal Cord Injury Research Centre, Neuroscience Institute, Tehran University of Medical Sciences, Tehran, Iran (Islamic Republic of), 4Biomedical Engineering Department, Shahed University, Tehran, Iran (Islamic Republic of), 5dr.mehvari@hotmail.com, Isfahan, Iran (Islamic Republic of)
To generate a decision-making tool for
lateralizing mesial temporal lobe epilepsy (mTLE) using decision tree and
random forest methods.
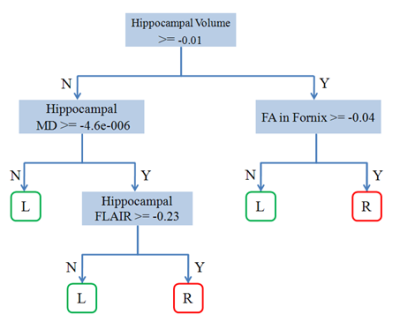
: Classification result using decision
tree method.
L : left TLE, R: right TLE.

Analysis of attribute importance using the
random forest method.
-
T2 relaxometry and 18F-FDG-PET alterations in hippocampus and hippocampal subfields in left and right MR-negative temporal lobe epilepsy
Hui Huang1, Miao Zhang2, Wei Liu3, Jia Wang1, Lihong Tang1, Qikang Li1, Biao Li2, and Jie Luo1
1School of Biomedical Engineering, Shanghai Jiao Tong University, Shanghai, China, 2Department of Nuclear Medicine, Ruijin Hospital, Shanghai Jiao Tong University School of Medicine, Shanghai, China, 3Department of Neurosurgery, Ruijin Hospital, Shanghai Jiao Tong University School of Medicine, Shanghai, China
We demonstrated
that combination of T2 and PET could complement each other in lateralization
for MR-negative LTLE. Our experimental results showed different alternation
of T2 relaxometry and 18F-FDG-PET in hippocampal regions.

Figure 1.
The statistical comparison of hippocampal volumes, mean T2 and PET SUVR in ipsilateral
hippocampus and hippocampal subregions vs contralateral regions. To the left of
the line is the ipsilateral ROIs, and to the right of the line is the contralateral
ROIs. MR-negative LTLE is shown in blue, and RTLE is shown in orange. The
significance level in all patients is indicated by a black asterisk. * P < 0.05, ** P < 0.01, *** P <
0.001.

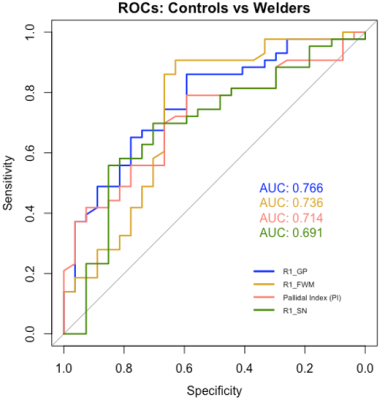
Figure
3. Receiver operating characteristic (ROC) curve of the classification-models.
-
Proton MR spectroscopy reveals metabolic alterations in generalized tonic clonic seizures before and after treatment: a longitudinal study
Xinyue Wan1, Xiaorui Su1, Simin Zhang1, Qiyong Gong1, and Qiang Yue2
1Huaxi MR Research Center (HMRRC), Department of Radiology, West China Hospital of Sichuan University, Chengdu, China, 2Department of Radiology, West China Hospital of Sichuan University, Chengdu, China
To explore metabolic alterations of DLPFC in GTCS and the effect of AEDs on metabolites concentration.

Fig.2 Metabolic difference among each group in the left (a) and right (b) DLPFC. *p < 0.05. Abbreviations: DLPFC, dorsolateral prefrontal cortex; HC, healthy control; Ins, Myoinositol; NAA, N-acetyl aspartate; Cho, choline; Cr, creatine; Glx = Glu + Gln (Glu, glutamate, Gln, glutamine).
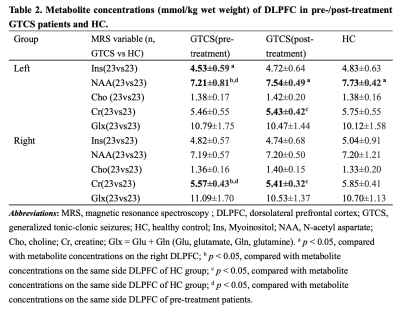
Table 2. Metabolite concentrations (mmol/kg wet weight) of DLPFC in pre-/post-treatment GTCS patients and HC. Abbreviations: Ins, Myoinositol; NAA, N-acetyl aspartate; Cho, choline; Cr, creatine; Glx = Glu + Gln (Glu, glutamate, Gln, glutamine). a p < 0.05, compared with metabolite concentrations on the right DLPFC; b p < 0.05, compared with metabolite concentrations on the same side DLPFC of HC; c p < 0.05, compared with metabolite concentrations on the same side DLPFC of HC; d p < 0.05, compared with metabolite concentrations on the same side DLPFC of pre-treatment patients.
-
Automated brain MRI volumetry and T1 relaxometry in children with focal epilepsy of unknown cause.
Baptiste MOREL1,2, Anne Sophie Piegay1, Maximilien Perivier1, Sandra Obry1, Bénédicte Maréchal3,4,5, Gian Franco Piredda3,4,5, Tom Hilbert3,4,5, Tobias Kober3,4,5, Clovis Tauber6, Pierre Castelnau6, and Jean Philippe Cottier1
1CHU de Tours, Tours, France, 2UMR 1253, iBrain, Université de Tours, INSERM, Tours, France, 3Advanced Clinical Imaging Technology, Siemens Healthcare AG, Lausanne, Switzerland, 4Department of Radiology, Lausanne University Hospital and University of Lausanne, Lausanne, Switzerland, 5LTS5, École Polytechnique Fédérale de Lausanne (EPFL), Lausanne, Switzerland, 6INSERM U1253, Tours, France
A postprocessing brain MRI allowed obtaining automatically both volumetry
and T1 relaxometry values. It helps radiologists to
quantify brain abnormalities undetected in brain MRI in more than 80% of the initial exploration of children
with focal epilepsy of unknown cause.

Sagittal, axial
and coronal views (line A, B and C) of the MP2RAGE sequence with the
postprocessing morphometric analysis results of a 6 years girl having left
focal epilepsia. UNI column is a highly contrasted T1 image. T1 relaxometry map
is the second column. Morphobox column represents the brain segmentation
obtained. A Volumetry and T1 relaxometry Z-score maps are also provided for a
visual analysis. We noticed a decreased T1 relaxometry values in the left
cortical occipital grey matter.
-
Neurochemical characteristics of pathological tissues in epilepsy: a 1H MRS study at 7T
Lijing Xin1,2, Philippe Reymond3, José Boto3, Serge Vulliemoz4, Francois Lazeyras 5, and Maria Isabel Vargas3
1CIBM Center for Biomedical Imaging, Lausanne, Switzerland, 2Animal Imaging and Technology, EPFL, Lausanne, Switzerland, 3Division of Neuroradiology, Diagnostic Department of Geneva University Hospitals and University of Geneva, Geneva, Switzerland, 4Division of Neurology, Neurosciences Department of Geneva University Hospitals and University of Geneva, Geneva, Switzerland, 5Center for Biomedical Imaging of Geneva and University of Geneva, Geneva, Switzerland
This study evaluated the tissue neurochemical by 1H
MRS in patient with epilepsy at 7T. Significant changes in macromolecule, N-acetyl
aspartate, total choline, glycine+myo-inositol, and a reduction trend of
glutamate were found in lesions of focal cortical dysplasia.

Figure 1. Neurochemical changes between lesion and
contralateral side in epilepsy patients with focal cortical dysplasia and non
MRI detectable lesion (* p< 0.05, + p<0.06).

Table 1.
Demographic data for patients (n=13)
including clinical presentation, seizure frequency, MR diagnosis and post-operative
clinical outcome.
-
Assessment of R1 Relaxometry Changes Induced via Repeated Videogame Training as a Measure of Neuroplasticity in College-aged Brains
Austin Bazydlo1, Steven Kecskemeti2, Aaron Cochrane3, Thomas Gorman4, Bas Rokers5, Douglas Dean1,6, C. Shawn Green3, and Andrew Alexander1,2,7
1Medical Physics, UW-Madison, Madison, WI, United States, 2Waisman Center for Brain Imaging, UW-Madison, Madison, WI, United States, 3Psychology, UW-Madison, Madison, WI, United States, 4Psychology, Indiana University-Bloomington, Bloomington, IN, United States, 5Psychology, NYU-Abu Dhabi, Abu Dhabi, United Arab Emirates, 6Pediatrics, UW-Madison, Madison, WI, United States, 7Psychiatry, UW-Madison, Madison, WI, United States
Quantitative R1 data generated using MPnRAGE were used as indication of plasticity in response to video game training in a group of typically developing, college-aged subjects. Long-term changes were observed in parietal and medial temporal lobe areas.

Table 1: Regional differences in mean R1 values from time 1 to time 3 in the NFS group.*corrected for multiple comparisons
-
Multi-Frequency Magnetization Transfer (MFMT) for Improved High-Resolution Human Hippocampal Imaging at 7 Tesla
Ronald J Beyers1, Adil Bashir1, and Thomas S Denney1
1MRI Research Center, Auburn University, Auburn University, AL, United States
Simultaneous Multi-Freq Saturation for Magnetization Transfer Contrast Enhancement in High-Resolution 3D Human Hippocampal MRI at 7 Tesla.

Multi-Frequency
Magnetization Transfer (MFMT) Sequence design.
MFMT is a saturation prep followed by 3d-FLASH acquisition. MFMT saturation prep allows multiplexing up
to four different/independent offset frequencies each with independent
bandwidths – thereby simultaneously saturating up to four different
frequencies. Sat RF pulses are Gaussian and run with RF phase stepping (RF
spoiling).

Representative
result Hippocampal transverse plane images qualitatively show a clear increase
in contrast between MFMT ‘On’ versus ‘Off’.
The yellow arrows specifically point to hippocampal regions and details
with obvious contrast increase when MFMT is ‘On’.
-
The Volume of Hippocampal Subfields in correlation with Middle Age Healthy Adults
Salem Alkhateeb1, Tales Santini2, Regina Leckie2, nadim farhat2, Peter J Gianaros2, Anna L Marsland2, Stephen B Manuck2, and Tamer S Ibrahim2
1Bioengineering, University of Pittsburgh, Pittsburgh, PA, United States, 2University of Pittsburgh, Pittsburgh, PA, United States
As hippocampal volume has been extensively utilized as a diagnosing tool to confirm diagnosis of many neurological disorders, this study aims to employ the high resolution 7T data to segment the hippocampal subfields then correlate their volumes with the age of healthy adults’ population. The region encompassing the subregions left DG, CA2, and CA3 showed significant correlation with age, with a volume variation of approximately -1% per year. Other regions presented a trend towards reductions that did turn into significant. Future work will investigate if differences in the hippocampus subfields are correlated with cognitive performance in this population.

Figure (3): In a) The final product of the hippocampus segmentation pipeline, each color represents a specific subfield. In b) Example of manual correction of a lesion that is labeled as DG.

Figure (2) First two stages of Image preparations for registration and segmentation. Top row shows the MPRAGE T1 weighted images, bottom row shows the TSE T2 weighted images